https://github.com/adrienc21/eitridatathon2022_media
Eitri Medical Datathon 2022 - News media & respiratory diseases dataset
Science Score: 13.0%
This score indicates how likely this project is to be science-related based on various indicators:
-
○CITATION.cff file
-
✓codemeta.json file
Found codemeta.json file -
○.zenodo.json file
-
○DOI references
-
○Academic publication links
-
○Academic email domains
-
○Institutional organization owner
-
○JOSS paper metadata
-
○Scientific vocabulary similarity
Low similarity (10.5%) to scientific vocabulary
Repository
Eitri Medical Datathon 2022 - News media & respiratory diseases dataset
Basic Info
- Host: GitHub
- Owner: AdrienC21
- License: mit
- Language: Python
- Default Branch: main
- Size: 1.93 MB
Statistics
- Stars: 0
- Watchers: 1
- Forks: 0
- Open Issues: 0
- Releases: 0
Metadata Files
README.md
Eitri Medical Datathon 2022 - News media & respiratory diseases dataset

Click here to visit the website of the event.
This repository contains the news media & respiratory diseases dataset as part of one of the challenges of the Eitri Medical Datathon 2022.
It contains data but also scripts to expand the dataset.
Installation
Clone this repository :
bash
git clone https://github.com/AdrienC21/eitridatathon2022_media.git
Or download the files manually.
Datasets
All files are located inside the folder datasets.
Disease, COVID data
msis_data.csv
Daily data for different diseases in Norway (at the national level) such as respiratory diseases. Source: MSIS.
IMPORTANT: Data can be obtained at the regional level, can be stratified by gender, age group and/or place of infection. We can also extract data from 1976 (instead of 2010). If needed, please ask a mentor to retrieve such data automatically.
NOR.csv
Daily COVID data at the national level (cases, deaths, vaccines, school closing, etc).
covid_cases_regions_norway.csv
Daily COVID cases data at the kommune level in Norway. The fylke of each kommune is also indicated. Extracted from John Hopkins University database.
Media Cloud & Google Trends
New Media Cloud and GoogleTrends data can be downloaded using the scripts generate_mediacloud.py and generate_googletrends.py, located inside the folder datasets.
You can find a list of countries in the excel files collections_country.csv (worldwide) and norway_collections.csv (specific for Norway).
Before running the scripts:
To fetch data for specific keywords, modify the keyword list in the file keywords.csv.
Change the configuration file
config.py(instructions below)
config.py allows one to change the list of countries, the timeframe, and the keywords for data retrieval.
IMPORTANT: If you need help to extract Media Cloud and Google Trends data, please call a mentor.
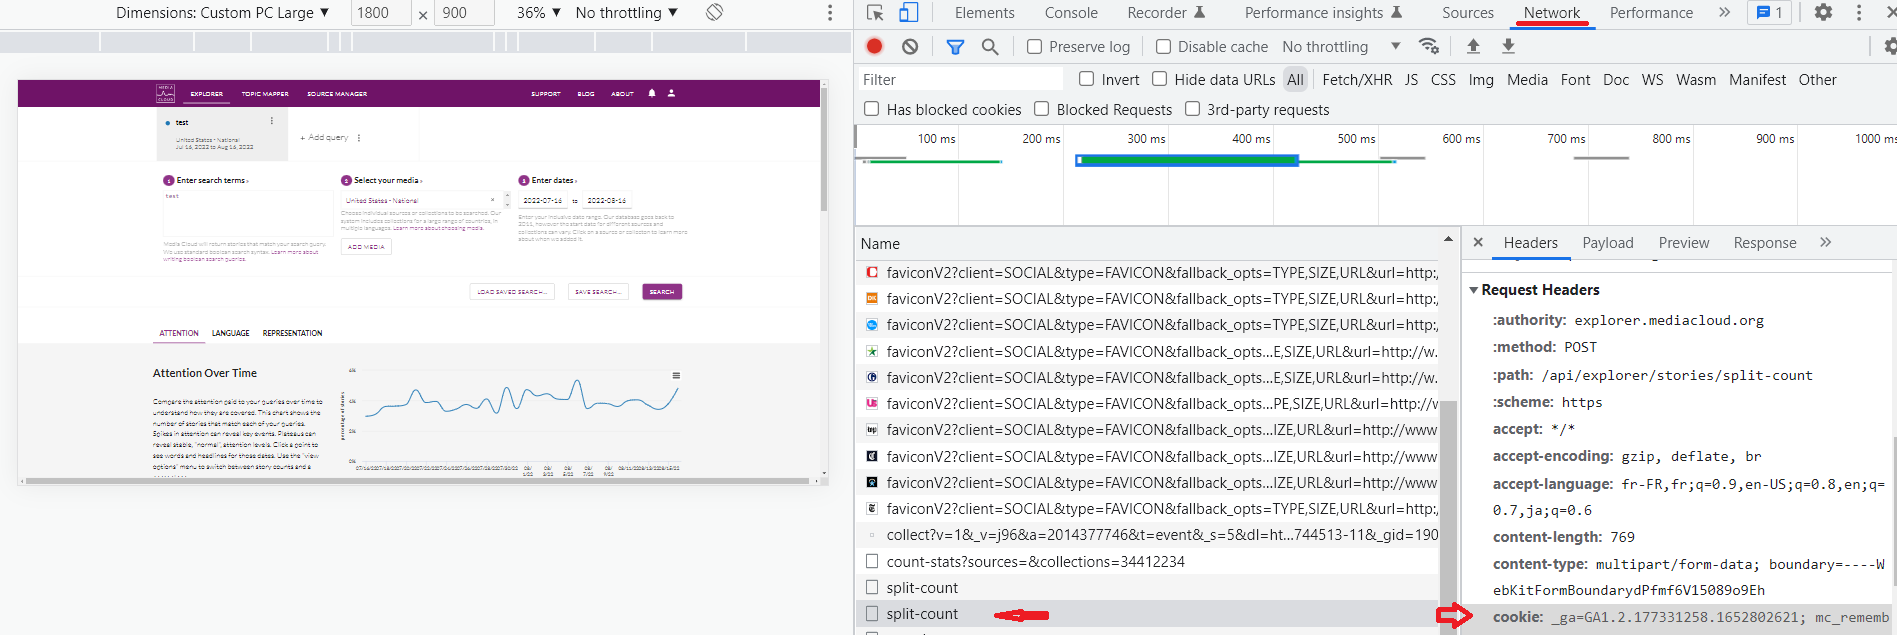
Media Cloud
For Media Cloud data, the dictionnary entitled login_info needs to be modified. To do so, connect to your Media Cloud account and open the Explorer tool. Inspect the webpage and go to the Network tab. After making a query, click on split-count. On the right, in Request Headers and cookie, retrieve the mc_remember_token and mc_session values and insert them into config.py.
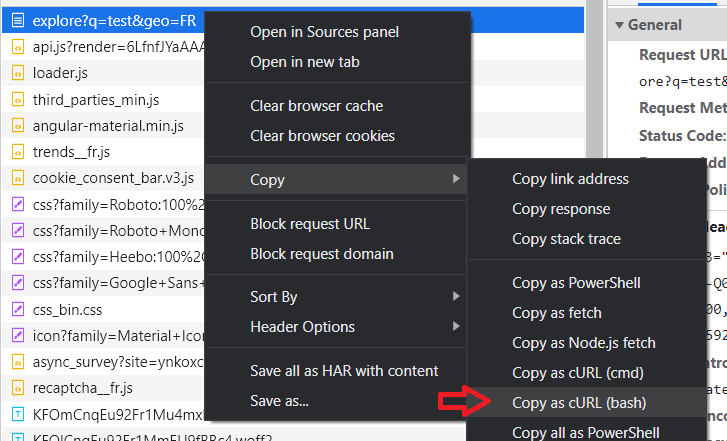
Google Trends
For Google Trends data, the header dictionnary must be updated. First, visit the Google Trends website, inspect the webpage and go to the Network tab. After making a query, right click on explore, and click on Copy as cURL (bash). Convert the command into a Python request using curlconverter. Retrieve only the header dictionnary.
Additional files
collections_country.csv
Contains the Media Cloud collection ids and the Google trends ISO codes of almost all the countries in the world.
norway.csv
Raw list of Media Cloud collection id for all regions in Norway.
norway_collections.csv
List of Media Cloud collection id for all regions in Norway & collection id for the national level.
fylke.csv
Map each counties in Norway to the corresponding fylke (county after 1 January 2020). Source.
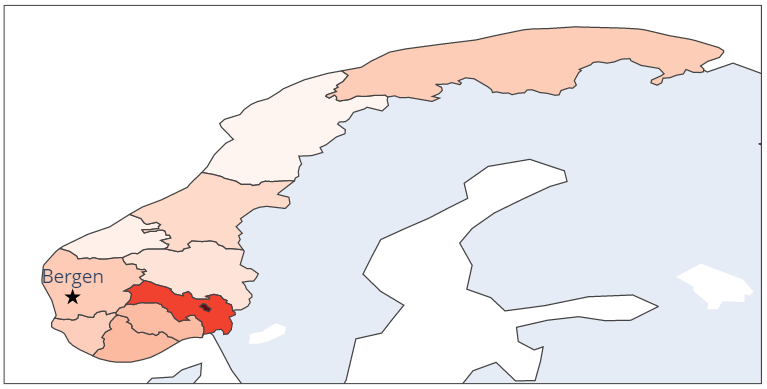
fylker_komprimert.csv
Geojson file with the boundaries of each county. Useful to plot choropleth map (an exemple of such plot is provided in the workshop: Leveraging Non-traditional Sources of Data).
Below is an example of plot that can be made using this file:
License
Owner
- Name: Adrien Carrel
- Login: AdrienC21
- Kind: user
- Location: London
- Website: https://adriencarrel.com/
- Twitter: adriencarrel_
- Repositories: 3
- Profile: https://github.com/AdrienC21
Quantitative Researcher MSc Imperial College London (Advanced Computing) MEng CentraleSupélec (Applied Mathematics, Diplôme d'ingénieur)
GitHub Events
Total
Last Year
Issues and Pull Requests
Last synced: over 1 year ago
All Time
- Total issues: 0
- Total pull requests: 0
- Average time to close issues: N/A
- Average time to close pull requests: N/A
- Total issue authors: 0
- Total pull request authors: 0
- Average comments per issue: 0
- Average comments per pull request: 0
- Merged pull requests: 0
- Bot issues: 0
- Bot pull requests: 0
Past Year
- Issues: 0
- Pull requests: 0
- Average time to close issues: N/A
- Average time to close pull requests: N/A
- Issue authors: 0
- Pull request authors: 0
- Average comments per issue: 0
- Average comments per pull request: 0
- Merged pull requests: 0
- Bot issues: 0
- Bot pull requests: 0