https://github.com/agrover112/scientific-visualization-book
❗️WIP❗️An open access book on scientific visualization using python and matplotlib
Science Score: 10.0%
This score indicates how likely this project is to be science-related based on various indicators:
-
○CITATION.cff file
-
○codemeta.json file
-
○.zenodo.json file
-
○DOI references
-
○Academic publication links
-
✓Committers with academic emails
1 of 1 committers (100.0%) from academic institutions -
○Institutional organization owner
-
○JOSS paper metadata
-
○Scientific vocabulary similarity
Low similarity (10.3%) to scientific vocabulary
Repository
❗️WIP❗️An open access book on scientific visualization using python and matplotlib
Statistics
- Stars: 0
- Watchers: 0
- Forks: 0
- Open Issues: 0
- Releases: 0
Metadata Files
README.md
![]() Scientific Python — Volume II
Scientific Python — Volume II
Scientific Visualization – Python & Matplotlib, Nicolas P. Rougier

An open access book on scientific visualization using python and matplotlib to be released during Sprint 2021 (hopefully). Sources will be available in this repository, the PDF book will be open-access and the printed book will cost 50$.
If you want to support the book, you can:
- Star the project
- Tip a few euros (10 €)
- Access the private repository (25 €) during the writing
(and let me know about your github handle) - Sponsor me through GitHub sponsorship program
- Nominate me for the GitHub stars program (it's free)
Note that in any case, the repository will be made public at the end of the writing and the PDF will be available for free.
In the meantime and if you're impatient, you can read:
- Python & OpenGL for Scientific Visualization
- From Python to Numpy
- 100 Numpy exercices
- Matplotlib cheat sheet
Latest news
You can read them on them news issue and subscribe to this specific issue to get notified about new posts.
Progress
You can follow progress on the project tab
Image of the week
The images below come from the book and have been made using matplotlib, of course.
![]() Flower Polar (poly collection)
Flower Polar (poly collection)

![]() Textual contours (text path)
Textual contours (text path)

![]() Typography (text, ticks)
Typography (text, ticks)

![]() Complex axes layout (axes, text, imshow)
Complex axes layout (axes, text, imshow)

![]() Signal multisampling (plot, collection, imshow)
Signal multisampling (plot, collection, imshow)

![]() Polygons & testing
Polygons & testing

![]() Polygons & clipping
Polygons & clipping

![]() Post-processing
Post-processing

![]() 3D projection
3D projection

![]() Polar projection
Polar projection

![]() Scales (plot + scales)
Scales (plot + scales)

![]() Matplotlib map (Contour + lines collection)
Matplotlib map (Contour + lines collection)

![]() Escher style (Polygons)
Escher style (Polygons)

![]() Many plots (plot & fill_between)
Many plots (plot & fill_between)

![]() Oriented histogram (axisartist toolkit)
Oriented histogram (axisartist toolkit)

![]() Seasonal plot (polar plot & patches)
Seasonal plot (polar plot & patches)

![]() Hatched bars (bar)
Hatched bars (bar)

![]() Platonic solids (PolyCollection)
Platonic solids (PolyCollection)

![]() Calendar heatmap (github activity) (Imshow, PolyCollection)
Calendar heatmap (github activity) (Imshow, PolyCollection)

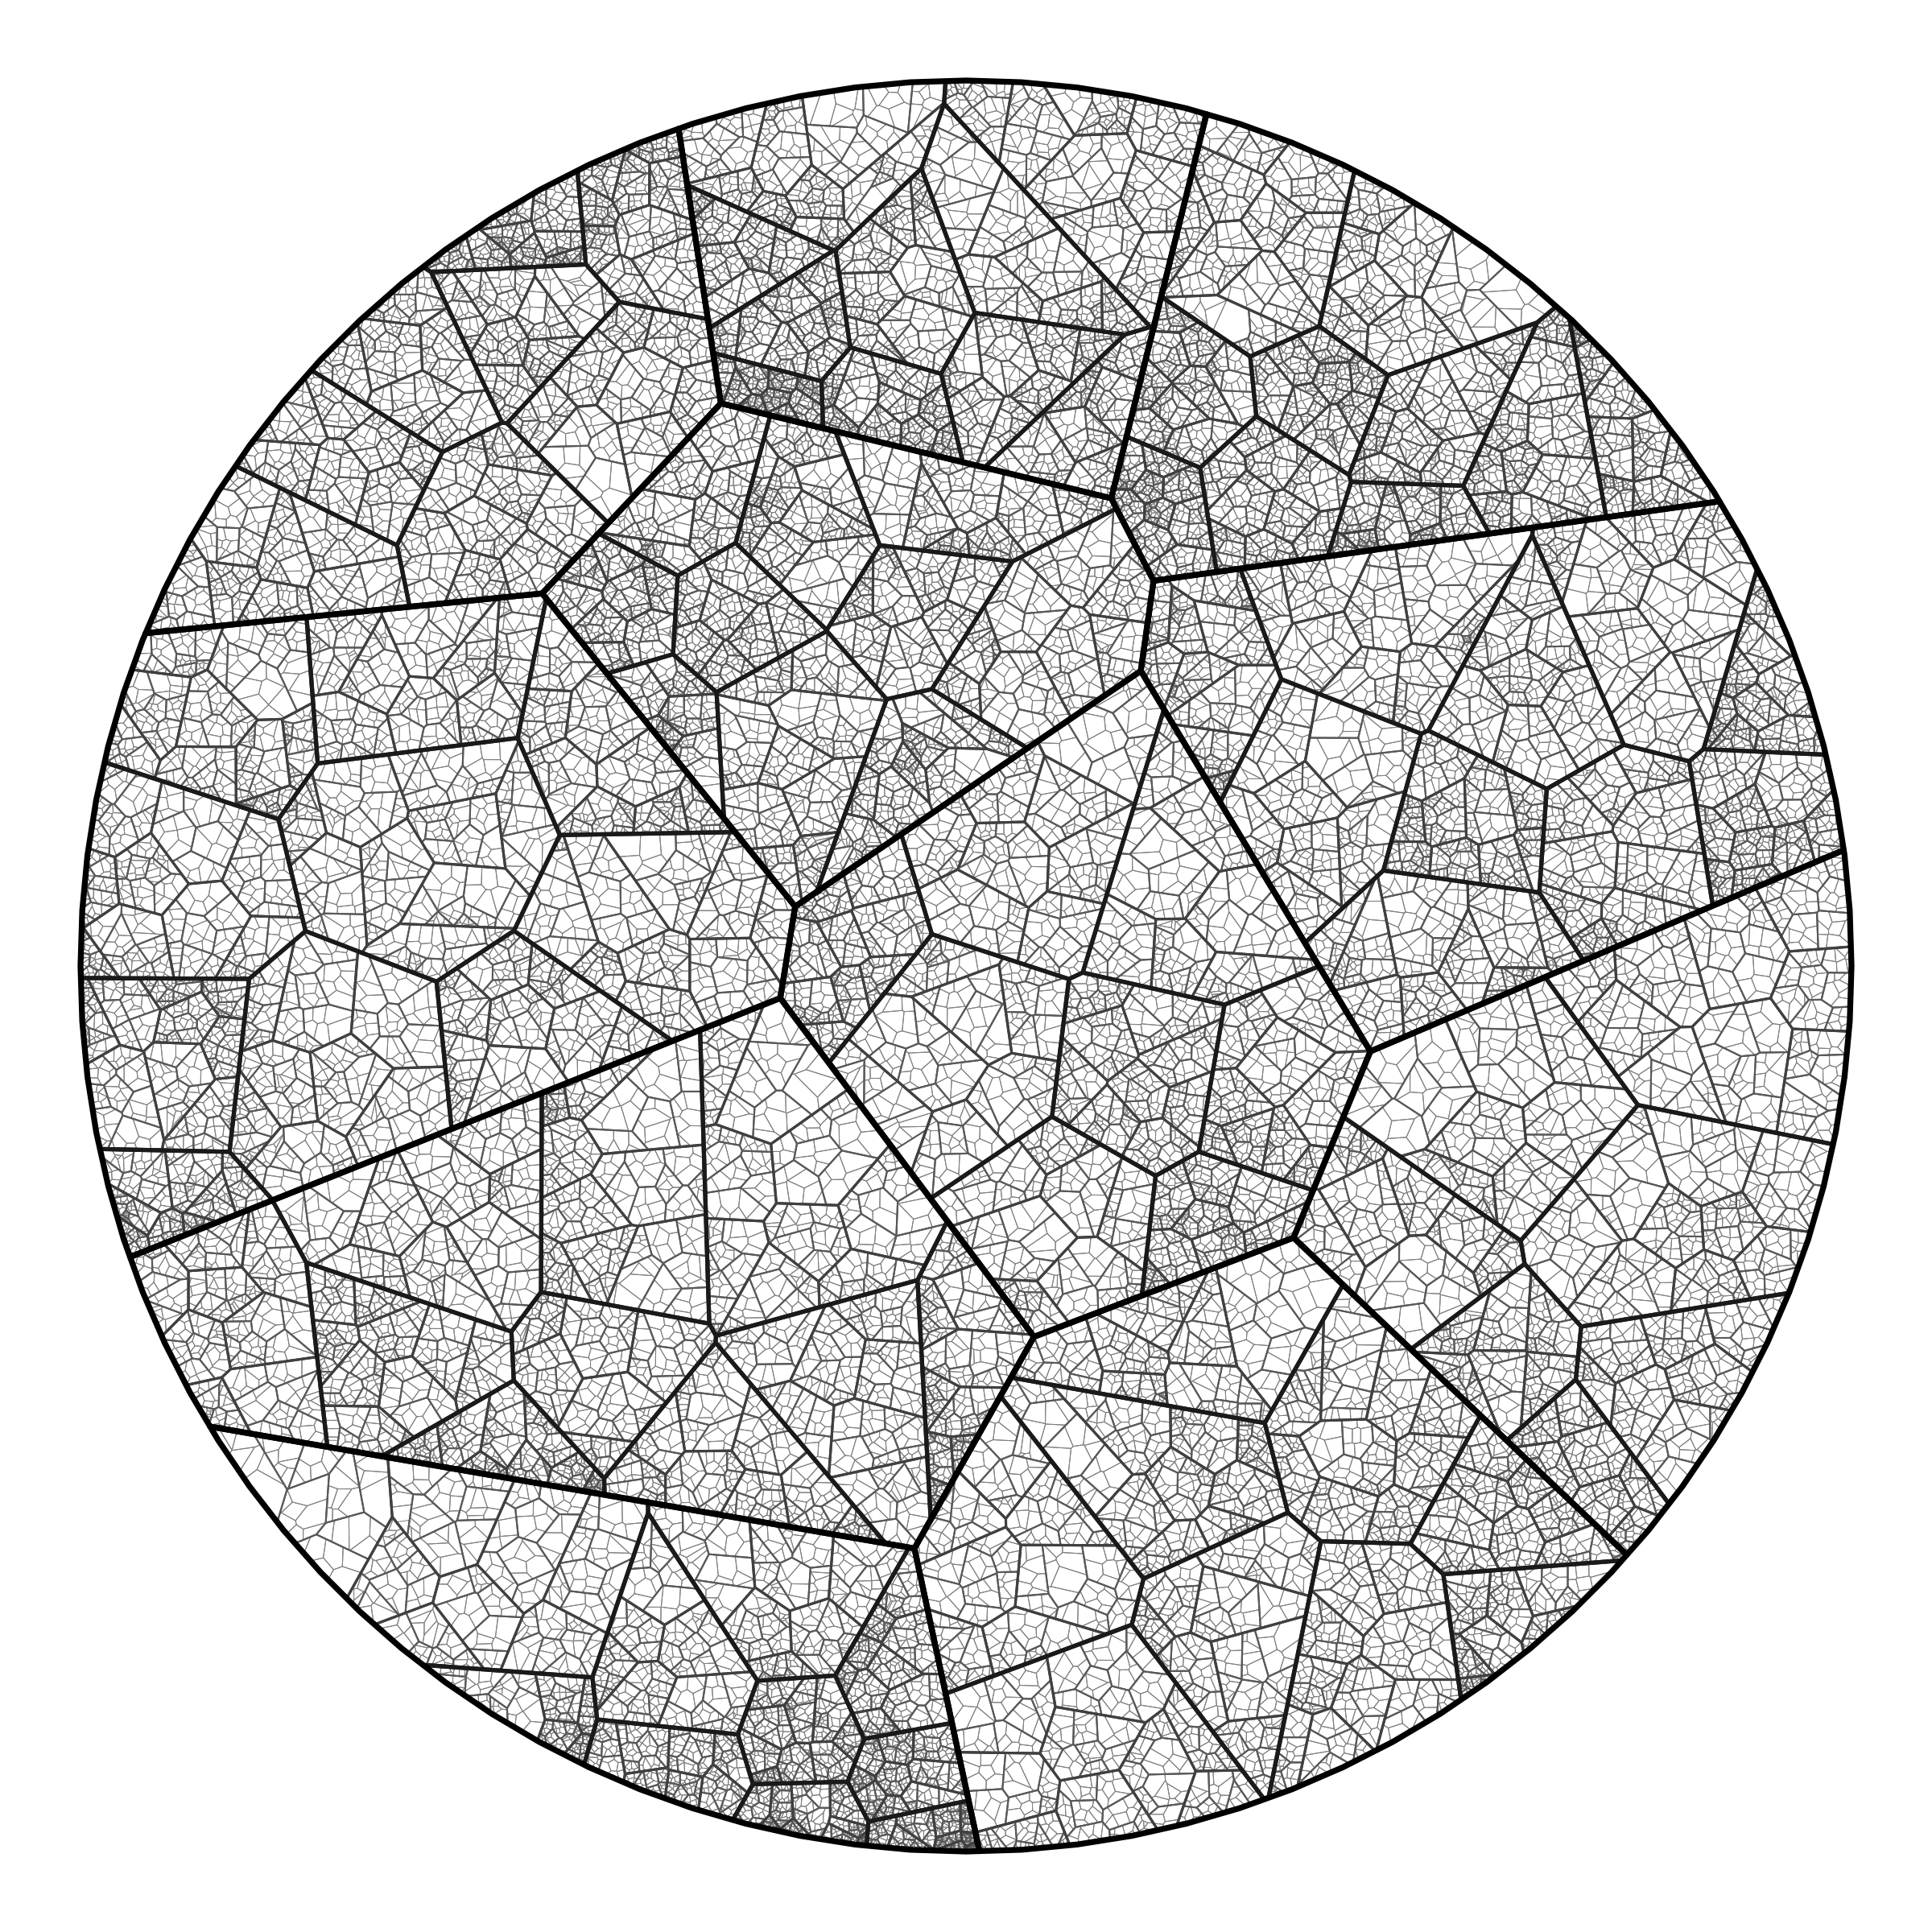
![]() Recursive Voronoi (PolyCollection)
Recursive Voronoi (PolyCollection)
![]() Scatter 3D (PolyCollection, scatter(s), Ellipses and custom 3D projection)
Scatter 3D (PolyCollection, scatter(s), Ellipses and custom 3D projection)

![]() Text shadow (TextPath, PolyCollection and imshow)
Text shadow (TextPath, PolyCollection and imshow)

![]() Boots (scatter plot)
Boots (scatter plot)

Owner
- Login: Agrover112
- Kind: user
- Repositories: 113
- Profile: https://github.com/Agrover112
Humans trying to understand machines and people.
GitHub Events
Total
Last Year
Committers
Last synced: 12 months ago
Top Committers
| Name | Commits | |
|---|---|---|
| Nicolas P. Rougier | N****r@i****r | 50 |
Committer Domains (Top 20 + Academic)
Issues and Pull Requests
Last synced: 12 months ago
All Time
- Total issues: 0
- Total pull requests: 0
- Average time to close issues: N/A
- Average time to close pull requests: N/A
- Total issue authors: 0
- Total pull request authors: 0
- Average comments per issue: 0
- Average comments per pull request: 0
- Merged pull requests: 0
- Bot issues: 0
- Bot pull requests: 0
Past Year
- Issues: 0
- Pull requests: 0
- Average time to close issues: N/A
- Average time to close pull requests: N/A
- Issue authors: 0
- Pull request authors: 0
- Average comments per issue: 0
- Average comments per pull request: 0
- Merged pull requests: 0
- Bot issues: 0
- Bot pull requests: 0