Science Score: 26.0%
This score indicates how likely this project is to be science-related based on various indicators:
-
○CITATION.cff file
-
✓codemeta.json file
Found codemeta.json file -
✓.zenodo.json file
Found .zenodo.json file -
○DOI references
-
○Academic publication links
-
○Committers with academic emails
-
○Institutional organization owner
-
○JOSS paper metadata
-
○Scientific vocabulary similarity
Low similarity (17.7%) to scientific vocabulary
Keywords from Contributors
drake
makefile
reproducibility
ropensci
Last synced: 9 months ago
·
JSON representation
Repository
Profile R code with pprof
Basic Info
- Host: GitHub
- Owner: r-prof
- License: other
- Language: R
- Default Branch: main
- Homepage: https://r-prof.github.io/proffer/
- Size: 22.9 MB
Statistics
- Stars: 89
- Watchers: 1
- Forks: 2
- Open Issues: 1
- Releases: 12
Created over 6 years ago
· Last pushed 12 months ago
Metadata Files
Readme
Changelog
Contributing
License
Code of conduct
Codemeta
README.Rmd
---
output: github_document
---
```{r, include = FALSE}
knitr::opts_chunk$set(
collapse = TRUE,
comment = "#>",
fig.path = "man/figures/README-",
out.width = "100%"
)
```
# proffer  [](https://cran.r-project.org/package=proffer)
[](https://opensource.org/licenses/MIT)
[](https://www.repostatus.org/#active)
[](https://github.com/r-prof/proffer/actions?workflow=check)
[](https://app.codecov.io/github/r-prof/proffer?branch=main)
The `proffer` package profiles R code to find bottlenecks. Visit
[](https://cran.r-project.org/package=proffer)
[](https://opensource.org/licenses/MIT)
[](https://www.repostatus.org/#active)
[](https://github.com/r-prof/proffer/actions?workflow=check)
[](https://app.codecov.io/github/r-prof/proffer?branch=main)
The `proffer` package profiles R code to find bottlenecks. Visit has a complete list of available functions in the package.
## Why use a profiler?
This data processing code is slow.
```{r, eval = FALSE}
system.time({
n <- 1e5
x <- data.frame(x = rnorm(n), y = rnorm(n))
for (i in seq_len(n)) {
x[i, ] <- x[i, ] + 1
}
x
})
#> user system elapsed
#> 82.060 28.440 110.582
```
Why exactly does it take so long? Is it because `for` loops are slow as a general rule? Let us find out empirically.
```{r, eval = FALSE}
library(proffer)
px <- pprof({
n <- 1e5
x <- data.frame(x = rnorm(n), y = rnorm(n))
for (i in seq_len(n)) {
x[i, ] <- x[i, ] + 1
}
x
})
#> ● url: http://localhost:57517
#> ● host: localhost
#> ● port: 57517
```
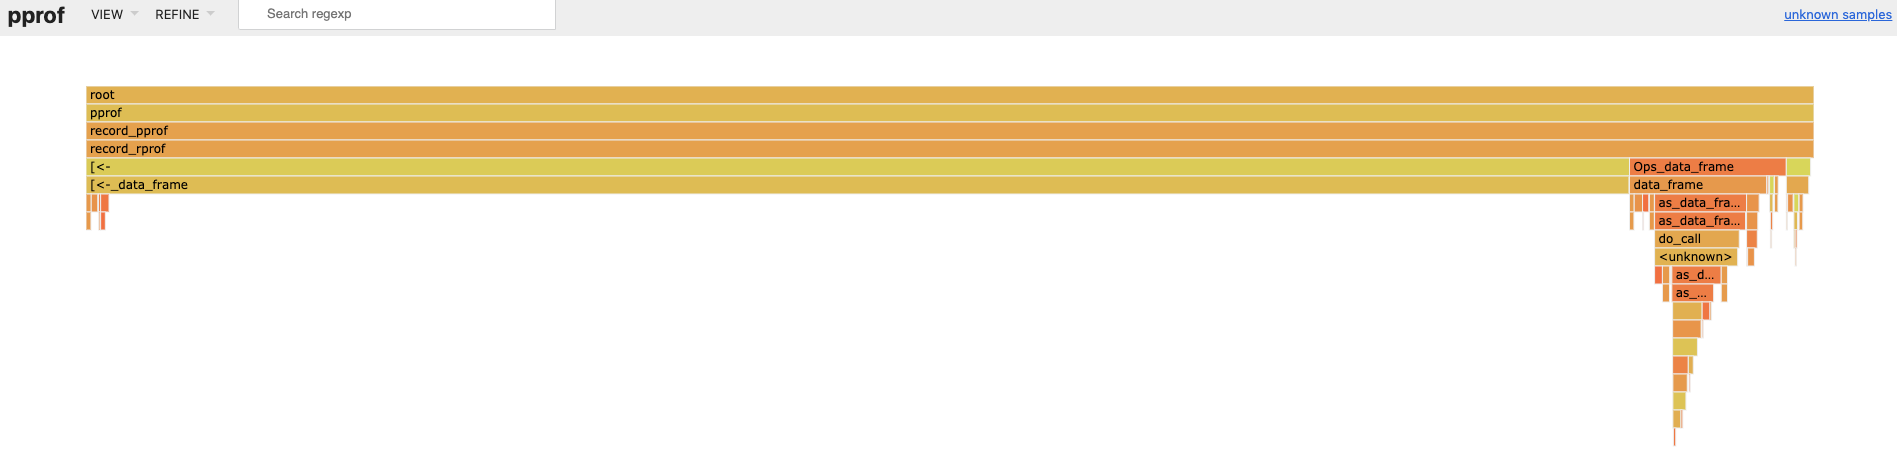
When we navigate to `http://localhost:64610` and look at the flame graph, we see `[<-.data.frame()` (i.e. `x[i, ] <- x[i, ] + 1`) is taking most of the runtime.
So we refactor the code to avoid data frame row assignment. Much faster, even with a `for` loop!
```{r}
system.time({
n <- 1e5
x <- rnorm(n)
y <- rnorm(n)
for (i in seq_len(n)) {
x[i] <- x[i] + 1
y[i] <- y[i] + 1
}
x <- data.frame(x = x, y = y)
})
```
Moral of the story: before you optimize, throw away your assumptions and run your code through a profiler. That way, you can spend your time optimizing where it counts!
## Managing the pprof server
The `pprof` server is a background [`processx`](https://github.com/r-lib/processx) process, and you can manage it with the `processx` methods [described here](https://processx.r-lib.org/#managing-external-processes). Remember to terminate the process with `$kill()` when you are done with it.
```{r, eval = FALSE}
# px is a process handler.
px <- pprof({
n <- 1e4
x <- data.frame(x = rnorm(n), y = rnorm(n))
for (i in seq_len(n)) {
x[i, ] <- x[i, ] + 1
}
x
})
#> ● url: http://localhost:50195
#> ● host: localhost
#> ● port: 50195
# Summary of the background process.
px
#> PROCESS 'pprof', running, pid 10451.
px$is_alive()
# [1] TRUE
# Error messages, some of which do not matter.
px$read_error()
#> [1] "Main binary filename not available.\n"
# Terminate the process when you are done.
px$kill()
```
## Serving pprof remotely
As with Jupyter notebooks, you can serve `pprof` from one computer and use it from another computer on the same network. On the server, you must
1. Find the server's host name or IP address in advance.
2. Supply `"0.0.0.0"` as the `host` argument.
```{r, eval = FALSE}
system2("hostname")
#> mycomputer
px <- pprof({
n <- 1e4
x <- data.frame(x = rnorm(n), y = rnorm(n))
for (i in seq_len(n)) {
x[i, ] <- x[i, ] + 1
}
x
}, host = "0.0.0.0")
#> ● url: http://localhost:610712
#> ● host: localhost
#> ● port: 610712
```
Then, in the client machine navigate a web browser to the server's host name or IP address and use the port number printed above, e.g. `https://mycomputer:61072`.
## Installation
For old versions of `proffer` (0.0.2 and below) refer to [these older installation instructions](https://github.com/r-prof/proffer/blob/f76bde56796396e83fee00f94430c94974f18303/README.md#installation) instead of the ones below.
### The R package
The latest release of `proffer` is available on [CRAN](https://CRAN.R-project.org).
```{r, eval = FALSE}
install.packages("proffer")
```
Alternatively, you can install the development version from GitHub.
```{r, eval = FALSE}
# install.packages("remotes")
remotes::install_github("r-prof/proffer")
```
The `proffer` package requires the `RProtoBuf` package, which may require installation of additional system dependencies on Linux. See its [installation instructions](https://github.com/eddelbuettel/rprotobuf#installation).
### Non-R dependencies
`proffer` requires the copy of `pprof` that comes pre-packaged with the Go language. You can install Go at .^[One of the graph visualizations requires Graphviz, which you , but this visualization is arguably not as useful as the flame graph.]
### Configuration
You can set the `PROFFER_GO_BIN` environment variable to a custom location for the Go binary. See [`usethis::edit_r_environ()`](https://usethis.r-lib.org/reference/edit.html) for directions on how to make this configuration permanent.
### Local testing
Run `pprof_sitrep()` again to verify that everything is installed and configured correctly.
```{r}
library(proffer)
pprof_sitrep()
```
If all dependencies are accounted for, `proffer` should work. Test it out with `test_pprof()`. On a local machine, it should launch a browser window showing an instance of `pprof`.
```{r, eval = FALSE}
library(proffer)
process <- test_pprof()
```
When you are done testing, you can clean up the process to conserve resources.
```{r, eval = FALSE}
process$kill()
```
## Telemetry
Recent versions of Go implement telemetry by default. Functions in `proffer` such as `pprof()` turn off telemetry in order to comply with CRAN policies. Read to learn how to restore telemetry settings after using `proffer`.
## Contributing
We encourage participation through [issues](https://github.com/r-prof/proffer/issues) and [pull requests](https://github.com/r-prof/proffer/pulls). `proffer` has a [Contributor Code of Conduct](https://github.com/r-prof/proffer/blob/main/CODE_OF_CONDUCT.md). By contributing to this project, you agree to abide by its terms.
## Resources
Profilers identify bottlenecks, but the do not offer solutions. It helps to learn about fast code in general so you can think of efficient alternatives to try.
-
-
## What about `profvis`
[`profvis`](https://github.com/r-lib/profvis) is a more widely used and established profiling package, and it existed before `proffer`.
`proffer` was originally developed because:
1. [`profvis`](https://github.com/r-lib/profvis) flame graphs [did not originally support aggregation](https://github.com/r-lib/profvis/issues/115).
2. [`profvis`](https://github.com/r-lib/profvis) visualizations [performed slowly on large profiling datasets](https://github.com/r-lib/profvis/issues/104).
Since then, (1) [has been fixed](https://github.com/r-lib/profvis/pull/126), and it is possible to produce aggregated flame graphs with `print(profvis::provis(...), aggregate = TRUE)`.
When (2) is also addressed, `proffer` may be superseded.
Owner
- Name: Tools for profiling R code
- Login: r-prof
- Kind: organization
- Repositories: 5
- Profile: https://github.com/r-prof
CodeMeta (codemeta.json)
{
  "@context": [
    "https://doi.org/10.5063/schema/codemeta-2.0",
    "http://schema.org"
  ],
  "@type": "SoftwareSourceCode",
  "identifier": "proffer",
  "description": "Like similar profiling tools,\n  the 'proffer' package automatically detects\n  sources of slowness in R code.\n  The distinguishing feature of 'proffer' is its utilization of\n  'pprof', which supplies interactive visualizations\n  that are efficient and easy to interpret.\n  Behind the scenes, the 'profile' package converts\n  native Rprof() data to a protocol buffer\n  that 'pprof' understands.\n  For the documentation of 'proffer',\n  visit <https://r-prof.github.io/proffer>.\n  To learn about the implementations and methodologies of\n  'pprof', 'profile', and protocol buffers,\n  visit <https://github.com/google/pprof>.\n  <https://developers.google.com/protocol-buffers>,\n  and <https://github.com/r-prof/profile>, respectively.",
  "name": "proffer: Profile R Code and Visualize with 'Pprof'",
  "codeRepository": "https://github.com/r-prof/proffer",
  "relatedLink": [
    "https://r-prof.github.io/proffer",
    "https://CRAN.R-project.org/package=proffer"
  ],
  "issueTracker": "https://github.com/r-prof/proffer/issues",
  "license": "https://spdx.org/licenses/MIT",
  "version": "0.1.0.9000",
  "programmingLanguage": {
    "@type": "ComputerLanguage",
    "name": "R",
    "version": "4.0.0",
    "url": "https://r-project.org"
  },
  "runtimePlatform": "R version 4.0.0 (2020-04-24)",
  "author": [
    {
      "@type": "Person",
      "givenName": [
        "William",
        "Michael"
      ],
      "familyName": "Landau",
      "email": "will.landau@gmail.com",
      "@id": "https://orcid.org/0000-0003-1878-3253"
    }
  ],
  "contributor": {},
  "copyrightHolder": [
    {
      "@type": "Organization",
      "name": "Eli Lilly and Company"
    }
  ],
  "funder": {},
  "maintainer": [
    {
      "@type": "Person",
      "givenName": [
        "William",
        "Michael"
      ],
      "familyName": "Landau",
      "email": "will.landau@gmail.com",
      "@id": "https://orcid.org/0000-0003-1878-3253"
    }
  ],
  "softwareSuggestions": [
    {
      "@type": "SoftwareApplication",
      "identifier": "testthat",
      "name": "testthat",
      "version": ">= 2.1.0",
      "provider": {
        "@id": "https://cran.r-project.org",
        "@type": "Organization",
        "name": "Comprehensive R Archive Network (CRAN)",
        "url": "https://cran.r-project.org"
      },
      "sameAs": "https://CRAN.R-project.org/package=testthat"
    }
  ],
  "softwareRequirements": [
    {
      "@type": "SoftwareApplication",
      "identifier": "R",
      "name": "R",
      "version": ">= 3.3.0"
    },
    {
      "@type": "SoftwareApplication",
      "identifier": "cli",
      "name": "cli",
      "provider": {
        "@id": "https://cran.r-project.org",
        "@type": "Organization",
        "name": "Comprehensive R Archive Network (CRAN)",
        "url": "https://cran.r-project.org"
      },
      "sameAs": "https://CRAN.R-project.org/package=cli"
    },
    {
      "@type": "SoftwareApplication",
      "identifier": "processx",
      "name": "processx",
      "provider": {
        "@id": "https://cran.r-project.org",
        "@type": "Organization",
        "name": "Comprehensive R Archive Network (CRAN)",
        "url": "https://cran.r-project.org"
      },
      "sameAs": "https://CRAN.R-project.org/package=processx"
    },
    {
      "@type": "SoftwareApplication",
      "identifier": "profile",
      "name": "profile",
      "provider": {
        "@id": "https://cran.r-project.org",
        "@type": "Organization",
        "name": "Comprehensive R Archive Network (CRAN)",
        "url": "https://cran.r-project.org"
      },
      "sameAs": "https://CRAN.R-project.org/package=profile"
    },
    {
      "@type": "SoftwareApplication",
      "identifier": "RProtoBuf",
      "name": "RProtoBuf",
      "provider": {
        "@id": "https://cran.r-project.org",
        "@type": "Organization",
        "name": "Comprehensive R Archive Network (CRAN)",
        "url": "https://cran.r-project.org"
      },
      "sameAs": "https://CRAN.R-project.org/package=RProtoBuf"
    },
    {
      "@type": "SoftwareApplication",
      "identifier": "utils",
      "name": "utils"
    },
    {
      "@type": "SoftwareApplication",
      "identifier": "withr",
      "name": "withr",
      "provider": {
        "@id": "https://cran.r-project.org",
        "@type": "Organization",
        "name": "Comprehensive R Archive Network (CRAN)",
        "url": "https://cran.r-project.org"
      },
      "sameAs": "https://CRAN.R-project.org/package=withr"
    }
  ],
  "releaseNotes": "https://github.com/wlandau/proffer/blob/main/NEWS.md",
  "readme": "https://github.com/r-prof/proffer/blob/main/README.md",
  "fileSize": "713.147KB",
  "contIntegration": [
    "https://travis-ci.org/r-prof/proffer",
    "https://ci.appveyor.com/project/r-prof/proffer",
    "https://codecov.io/github/r-prof/proffer?branch=main"
  ],
  "developmentStatus": "https://www.repostatus.org/#active",
  "provider": {
    "@id": "https://cran.r-project.org",
    "@type": "Organization",
    "name": "Comprehensive R Archive Network (CRAN)",
    "url": "https://cran.r-project.org"
  }
}
GitHub Events
Total
- Create event: 2
- Issues event: 1
- Release event: 2
- Watch event: 7
- Issue comment event: 2
- Push event: 18
Last Year
- Create event: 2
- Issues event: 1
- Release event: 2
- Watch event: 7
- Issue comment event: 2
- Push event: 18
Committers
Last synced: over 2 years ago
Top Committers
| Name | Commits | |
|---|---|---|
| wlandau | w****u@g****m | 122 |
| wlandau-lilly | w****u@l****m | 66 |
| Kirill Müller | k****r@m****g | 8 |
| Kirill Müller | k****r@m****g | 1 |
| Will Landau | 1****u | 1 |
Committer Domains (Top 20 + Academic)
mailbox.org: 2
lilly.com: 1
Issues and Pull Requests
Last synced: 9 months ago
All Time
- Total issues: 27
- Total pull requests: 5
- Average time to close issues: 14 days
- Average time to close pull requests: 10 days
- Total issue authors: 10
- Total pull request authors: 2
- Average comments per issue: 1.81
- Average comments per pull request: 4.6
- Merged pull requests: 5
- Bot issues: 0
- Bot pull requests: 0
Past Year
- Issues: 1
- Pull requests: 0
- Average time to close issues: N/A
- Average time to close pull requests: N/A
- Issue authors: 1
- Pull request authors: 0
- Average comments per issue: 0.0
- Average comments per pull request: 0
- Merged pull requests: 0
- Bot issues: 0
- Bot pull requests: 0
Top Authors
Issue Authors
- wlandau (15)
- krlmlr (3)
- HenrikBengtsson (2)
- liutiming (1)
- snowpong (1)
- kuriwaki (1)
- Robinlovelace (1)
- strazto (1)
- gaborcsardi (1)
- JodyStats (1)
Pull Request Authors
- wlandau (4)
- krlmlr (1)
Top Labels
Issue Labels
type: new feature (8)
type: question (5)
topic: documentation (3)
topic: configuration (3)
type: trouble (2)
topic: cran (2)
topic: dependencies (2)
type: bug (1)
status: incompatible (1)
status: priority (1)
status: won't fix (1)
difficulty: good first issue (1)
Pull Request Labels
topic: configuration (2)
topic: documentation (1)
Packages
- Total packages: 1
-
Total downloads:
- cran 611 last-month
- Total docker downloads: 41,971
- Total dependent packages: 0
- Total dependent repositories: 1
- Total versions: 9
- Total maintainers: 1
cran.r-project.org: proffer
Profile R Code and Visualize with 'Pprof'
- Homepage: https://github.com/r-prof/proffer
- Documentation: http://cran.r-project.org/web/packages/proffer/proffer.pdf
- License: MIT + file LICENSE
-
Latest release: 0.2.2
published over 1 year ago
Rankings
Docker downloads count: 0.6%
Stargazers count: 4.6%
Forks count: 17.0%
Average: 19.9%
Dependent repos count: 23.9%
Dependent packages count: 28.7%
Downloads: 44.6%
Maintainers (1)
Last synced:
9 months ago