scFeatures
Science Score: 57.0%
This score indicates how likely this project is to be science-related based on various indicators:
-
○CITATION.cff file
-
✓codemeta.json file
Found codemeta.json file -
✓.zenodo.json file
Found .zenodo.json file -
✓DOI references
Found 2 DOI reference(s) in README -
○Academic publication links
-
✓Committers with academic emails
3 of 5 committers (60.0%) from academic institutions -
✓Institutional organization owner
Organization sydneybiox has institutional domain (www.sydney.edu.au) -
○JOSS paper metadata
-
○Scientific vocabulary similarity
Low similarity (9.3%) to scientific vocabulary
Repository
Basic Info
- Host: GitHub
- Owner: SydneyBioX
- Language: R
- Default Branch: devel
- Homepage: https://sydneybiox.github.io/scFeatures/
- Size: 213 MB
Statistics
- Stars: 13
- Watchers: 8
- Forks: 2
- Open Issues: 9
- Releases: 0
Metadata Files
README.md
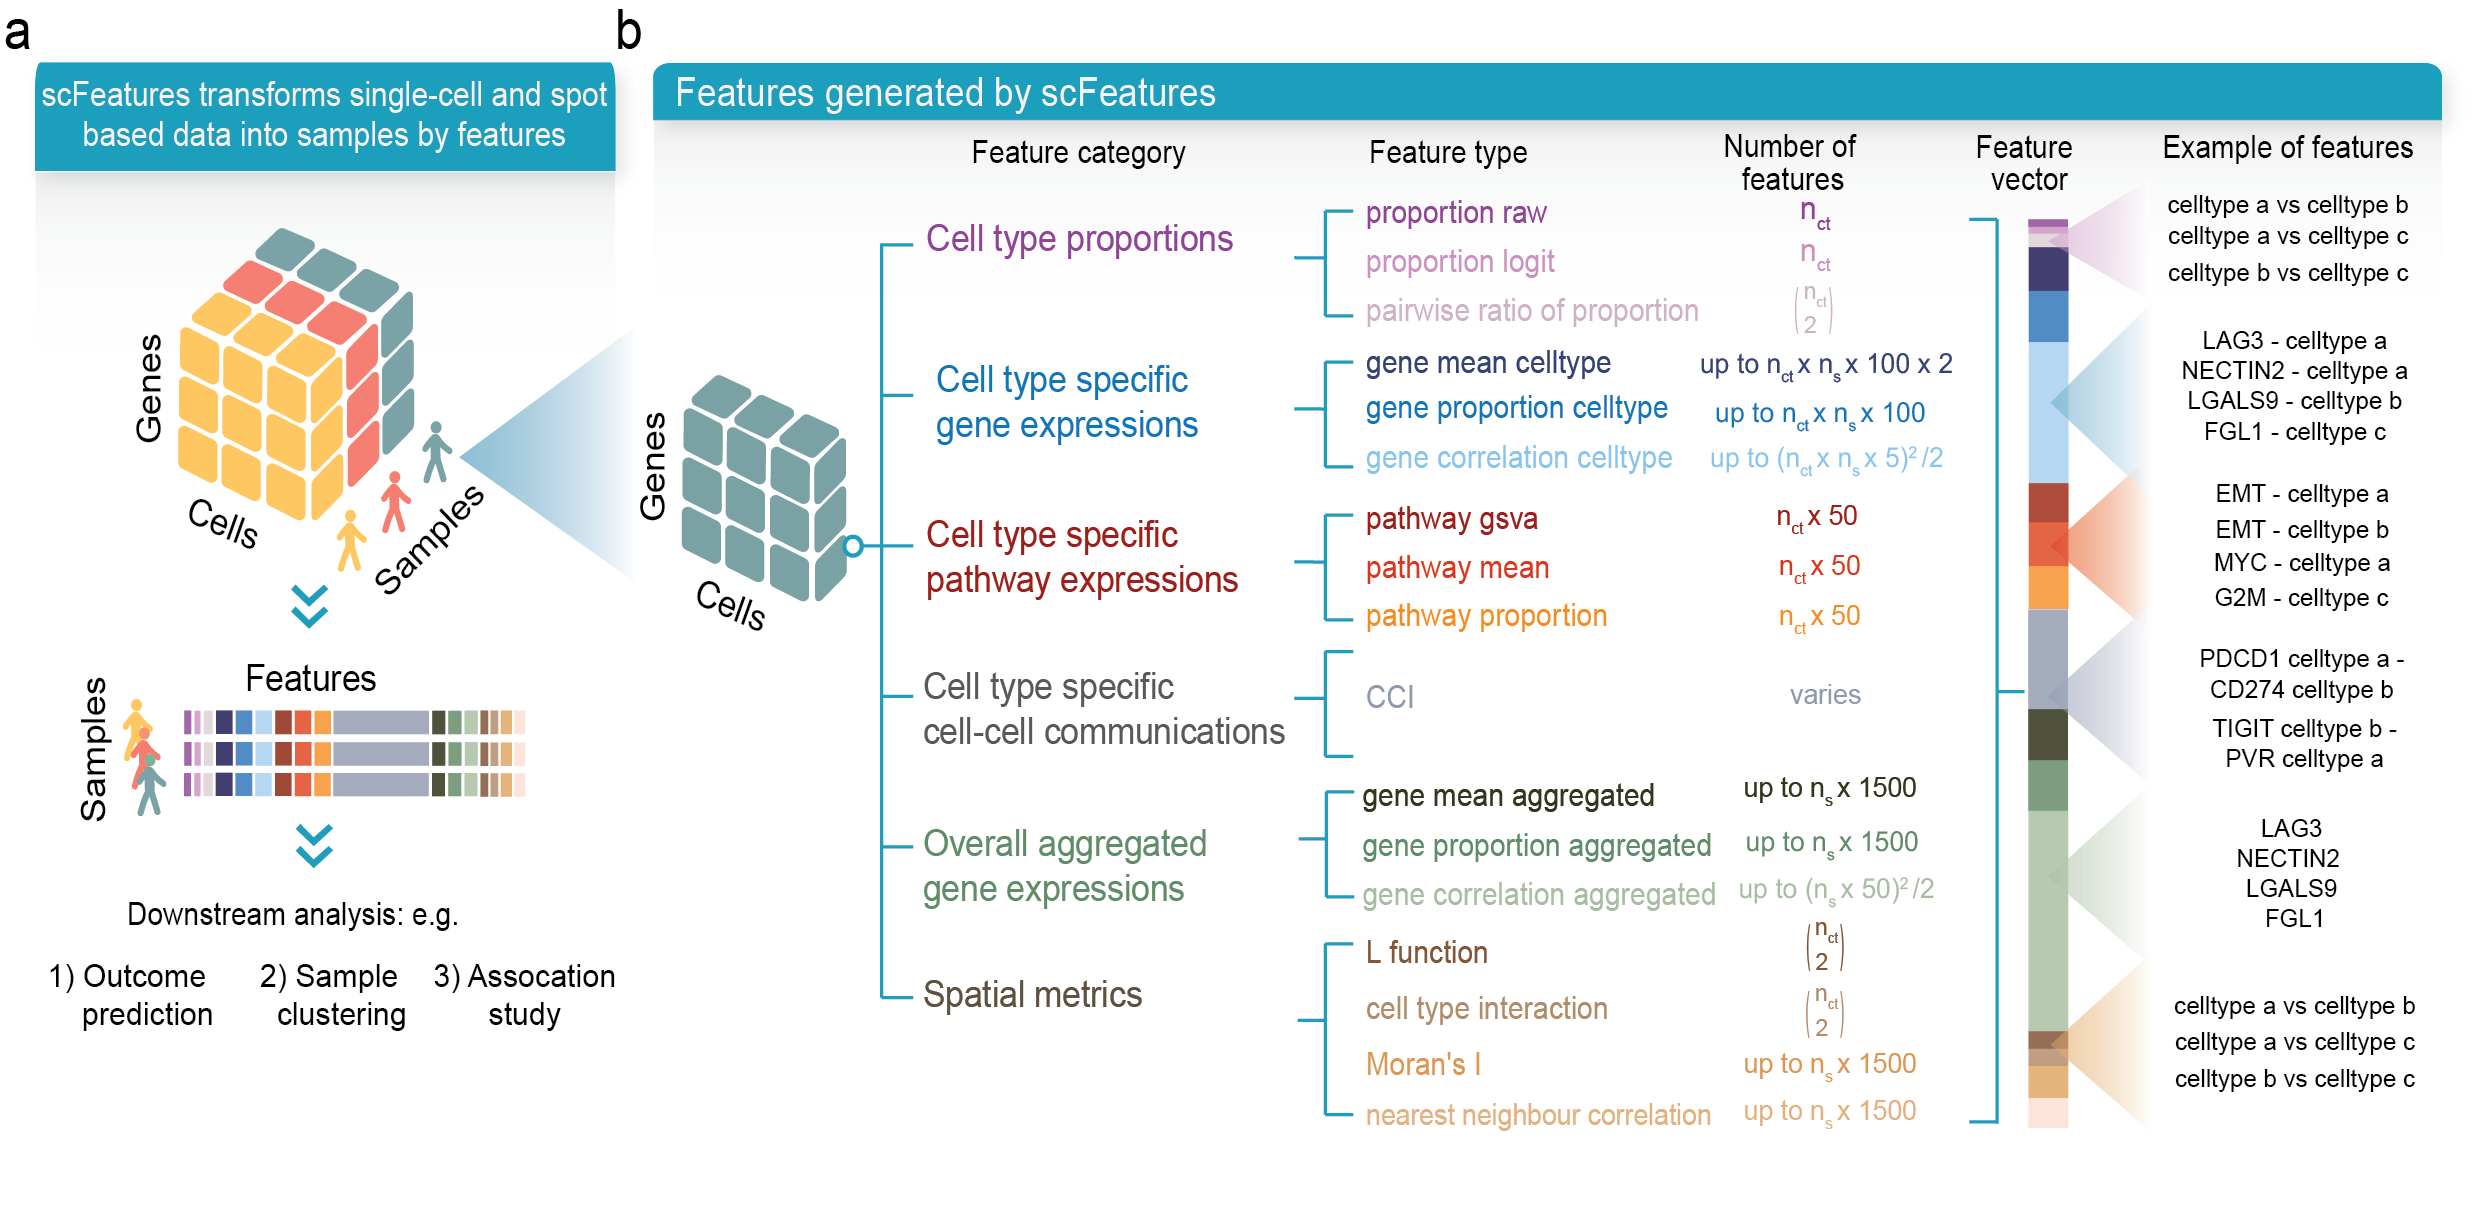
scFeatures: Multi-view representations of single-cell and spatial data for disease outcome prediction
scFeatures is a tool that generates multi-view representations of single-cell and spatial data through the construction of a total of 17 feature types belonging to the following six categories.
- cell type proportions
- cell type specific gene expressions
- cell type specific pathway expressions
- cell type specific cell-cell interaction (CCI) scores
- overall aggregated gene expressions
- spatial metrics
Installation
The latest scFeatures can be installed using devtools:
library(devtools)
devtools::install_github("SydneyBioX/scFeatures")
Quick start
scFeatures can be run using one line of code
scfeatures_result <- scFeatures(data = data, sample = sample, celltype = celltype)
which generates a list of dataframes containing all feature types in the form of samples x features.
Currently, scFeatures support scRNA-seq, spatial proteomics and spatial transcriptomics.
For scRNA-seq, run:
``` data("examplescrnaseq" , package = "scFeatures") data <- examplescrnaseq
scfeatures_result <- scFeatures(data = data@assays$RNA@data,
sample = data$sample,
celltype = data$celltype,
type = "scrna",
ncores = 8,
species = "Homo sapiens")
```
For spatial proteomics, run:
```
note, spatial data requires spatial coordinates of each cell.
spatialCoords <- list( sample( 1:ncol(data), ncol(data)) , sample( 1:ncol(data), ncol(data) )) # generate fake coordinates
scfeaturesresult <- scFeatures(data = data@assays$RNA@data,
sample = data$sample,
celltype = data$celltype,
type = "spatialp",
spatialCoords = spatialCoords,
ncores = 8,
species = "Homo sapiens")
```
For spatial transcriptomics, run:
```
note, spatial data requires spatial coordinates of each cell.
spatialCoords <- list( sample( 1:ncol(data), ncol(data)) , sample( 1:ncol(data), ncol(data) ))
as well as predicted probability of cell types in each spot
spotProbability <- t(gtools::rdirichlet( ncol(data), rep(1, 5))) # simulate the cell type prediction result based on 5 cell types rownames( spotProbability) <- c("Cell type A", "Cell type B" , "Cell type C", "Cell type D", "Cell type E") colnames( spotProbability ) <- colnames(data)
scfeaturesresult <- scFeatures(data = data@assays$RNA@data,
sample = data$sample,
celltype = data$celltype,
type = "spatialt",
spatialCoords = spatialCoords,
spotProbability = spotProbability,
ncores = 8,
species = "Homo sapiens")
```
Detailed vignette
Please see https://sydneybiox.github.io/scFeatures/articles/scFeatures_overview.html.
Reference
Cao, Y., Lin, Y., Patrick, E., Yang, P., & Yang, J. Y. H. (2022). scFeatures: multi-view representations of single-cell and spatial data for disease outcome prediction. In O. Vitek (Ed.), Bioinformatics (Vol. 38, Issue 20, pp. 4745–4753). Oxford University Press (OUP). https://doi.org/10.1093/bioinformatics/btac590
Owner
- Name: Sydney Precision Data Science Centre
- Login: SydneyBioX
- Kind: organization
- Location: Sydney, Australia
- Website: https://www.sydney.edu.au/science/our-research/research-centres/sydney-precision-data-science-centre.html
- Twitter: sydneybioinfo
- Repositories: 76
- Profile: https://github.com/SydneyBioX
SPDSC alliance brings together multiple research groups and junior and senior researchers with shared interests in bioinformatics and computational sciences.
GitHub Events
Total
- Issues event: 1
- Watch event: 2
- Push event: 4
Last Year
- Issues event: 1
- Watch event: 2
- Push event: 4
Committers
Last synced: over 2 years ago
Top Committers
| Name | Commits | |
|---|---|---|
| Nicholas Robertson | n****r@g****m | 217 |
| Yue Cao | y****o@s****u | 163 |
| Yue Cao | y****u@g****m | 50 |
| Ellis Patrick | e****k@s****u | 11 |
| Yue Cao | y****c@m****u | 1 |
Committer Domains (Top 20 + Academic)
Packages
- Total packages: 1
-
Total downloads:
- bioconductor 5,248 total
- Total dependent packages: 0
- Total dependent repositories: 0
- Total versions: 6
- Total maintainers: 1
bioconductor.org: scFeatures
scFeatures: Multi-view representations of single-cell and spatial data for disease outcome prediction
- Homepage: https://sydneybiox.github.io/scFeatures/ https://github.com/SydneyBioX/scFeatures/
- Documentation: https://bioconductor.org/packages/release/bioc/vignettes/scFeatures/inst/doc/scFeatures.pdf
- License: GPL-3
-
Latest release: 1.8.0
published about 1 year ago
Rankings
Maintainers (1)
Dependencies
- ClassifyR * imports
- DelayedArray * imports
- DelayedMatrixStats * imports
- EnsDb.Hsapiens.v79 * imports
- EnsDb.Mmusculus.v79 * imports
- GSVA * imports
- Seurat * imports
- ape * imports
- dplyr * imports
- ensembldb * imports
- gtools * imports
- msigdbr * imports
- parallel * imports
- plyr * imports
- proxyC * imports
- reshape2 * imports
- spatstat.core * imports
- spatstat.geom * imports
- tidyr * imports
- knitr * suggests
- rmarkdown * suggests