Science Score: 46.0%
This score indicates how likely this project is to be science-related based on various indicators:
-
○CITATION.cff file
-
✓codemeta.json file
Found codemeta.json file -
○.zenodo.json file
-
✓DOI references
Found 2 DOI reference(s) in README -
✓Academic publication links
Links to: nature.com -
✓Committers with academic emails
1 of 2 committers (50.0%) from academic institutions -
○Institutional organization owner
-
○JOSS paper metadata
-
○Scientific vocabulary similarity
Low similarity (12.0%) to scientific vocabulary
Repository
Repository for the Bioconductor squallms R package
Basic Info
Statistics
- Stars: 3
- Watchers: 1
- Forks: 0
- Open Issues: 8
- Releases: 0
Metadata Files
README.md
Speedy quality assurance via lasso labeling for untargeted MS data (squallms)
Overview
squallms is a Bioconductor R package that implements a "semi-labeled" approach to untargeted mass spectrometry data. It pulls in raw data from mass-spec files to calculate several metrics that are then used to label MS features in bulk as high or low quality that are then passed to a simple logistic model that produces a fully-labeled dataset suitable for downstream analysis.
Step 0: Installation
squallms isn't yet on Bioconductor, so the easiest way to install it is directly from Github with the remotes package. This section will be updated once it's on Bioconductor properly.
remotes::install_github("https://github.com/wkumler/squallms")
Once installed, squallms can be loaded like any other package:
library(squallms)
Step 1: Metric extraction
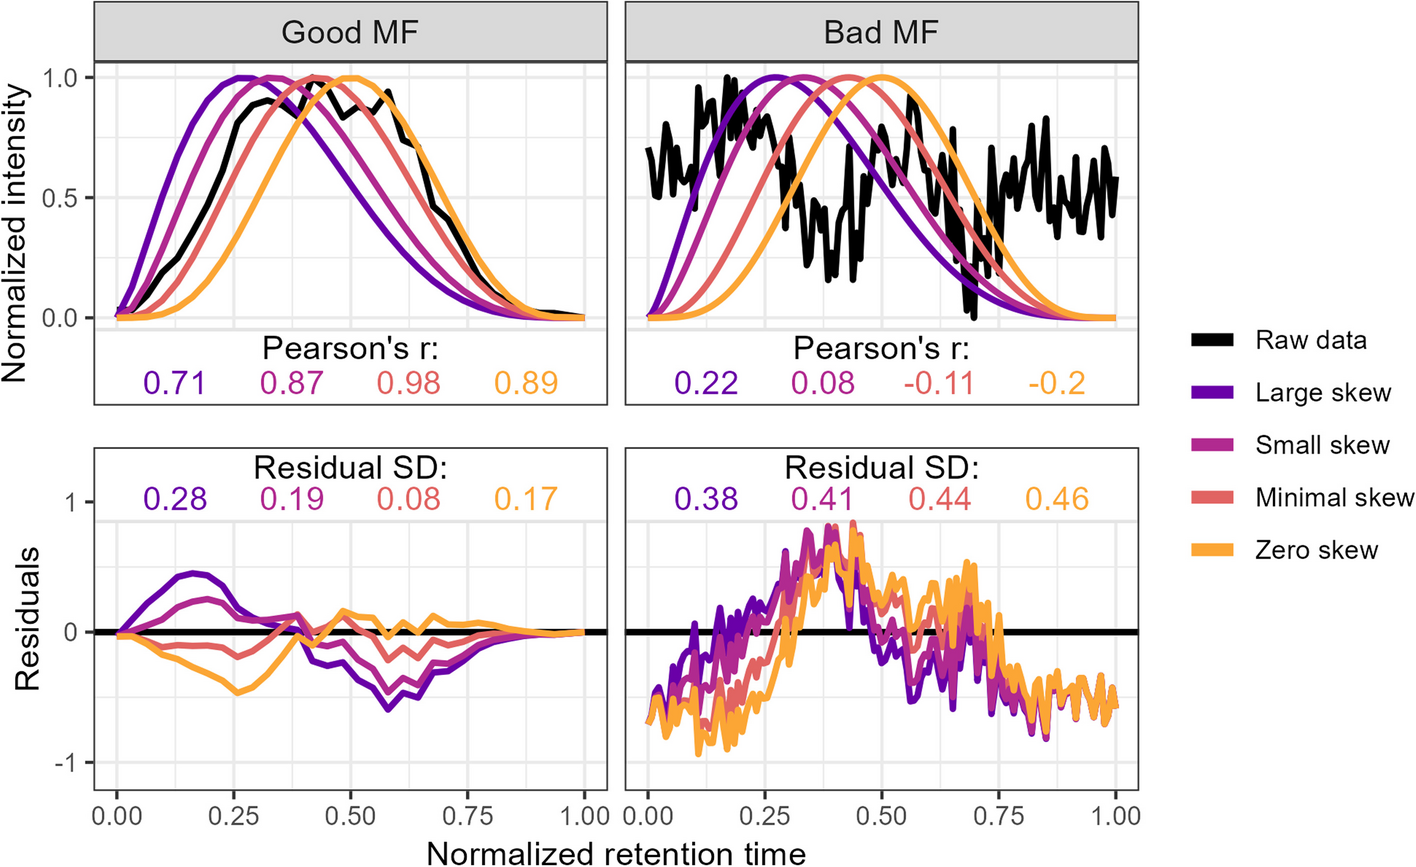
squallms obtains peak quality metrics in two ways. First, it compares individual MS features to an idealized bell shape as detailed in Kumler et al. 2023 (figure below) to extract the betacor and betasnr metrics. Second, it constructs a retention time by filename by normalized intensity matrix and performs a PCA to extract the dominant feature signal - typically also a bell curve represented in the first or second principal components. The PCs are used to group together similar features for rapid annotation in Step 2, while the betacor and betasnr metrics are used alongside the labels to construct the logistic model in Step 3 below.
Step 2: Labeling
Two labeling tools are provided for rapid MS feature classification. The first uses a Shiny app to render each feature as a chromatogram and accepts keybound inputs to assign classes to the feature. The second uses the PCA coordinates extracted in Step 1 to place features in a similarity space and triggers a small Shiny app to label clusters of compounds using the "lasso" tool. Both tools produce a named vector of features with classifications used to train the logistic model detailed in Step 3.
Built-in Shiny app for simultaneous lasso labeling of similar features:

Step 3: Logistic modeling
After metrics have been extracted and labeling has occurred, a logistic model can be trained to predict MS feature class from the betacor and betasnr values obtained in Step 1 (and additional metrics supplied by the user). This model returns the estimated likelihood of each peak being classified as "Good" or "Bad" which can then be used to remove features that fall below a given likelihood threshold.
Demo:
``` library(tidyverse) library(xcms) library(MSnbase) library(RaMS)
remotes::install_github("https://github.com/wkumler/squallms")
library(squallms)
mzML_files <- list.files(system.file("extdata", package = "RaMS"), full.names=TRUE)[c(3,5,6)]
register(BPPARAM = SerialParam(progressbar = TRUE)) msnexpfilled <- readMSData(files = mzMLfiles, msLevel. = 1, mode = "onDisk") %>% findChromPeaks(CentWaveParam(snthresh = 0)) %>% adjustRtime(ObiwarpParam(binSize = 0.1, response = 1, distFun = "cor_opt")) %>% groupChromPeaks(PeakDensityParam(sampleGroups = 1:3, bw = 12, minFraction = 0, binSize = 0.001, minSamples = 0)) %>% fillChromPeaks(FillChromPeaksParam(ppm = 5))
msdata <- grabMSdata(mzMLfiles, grabwhat = "MS1") peakdata <- makeXcmsObjFlat(msnexpfilled) featmetrics <- extractChromMetrics(peakdata, recalcbetas = TRUE, verbosity = 2, ms1data = msdata$MS1) classlabels <- labelFeatsLasso(peakdata, ms1_data=msdata$MS1, verbosity=1)
Alternatively, if manual labeling is desired:
classlabels <- labelFeatsManual(peakdata, ms1_data=msdata$MS1, verbosity=1)
cleanedxcmsobj <- updateXcmsObjFeats(msnexpfilled, featmetrics, classlabels, likelihoodthreshold=0.5, verbosity=2) ```
Owner
- Name: William
- Login: wkumler
- Kind: user
- Location: University of Washington, Seattle, WA
- Repositories: 2
- Profile: https://github.com/wkumler
Graduate student at the University of Washington
GitHub Events
Total
- Issues event: 1
- Issue comment event: 1
Last Year
- Issues event: 1
- Issue comment event: 1
Committers
Last synced: 10 months ago
Top Committers
| Name | Commits | |
|---|---|---|
| wkumler | w****r@u****u | 124 |
| William Kumler | 4****r@u****m | 3 |
Committer Domains (Top 20 + Academic)
Packages
- Total packages: 1
-
Total downloads:
- bioconductor 2,291 total
- Total dependent packages: 0
- Total dependent repositories: 0
- Total versions: 2
- Total maintainers: 1
bioconductor.org: squallms
Speedy quality assurance via lasso labeling for LC-MS data
- Homepage: https://github.com/wkumler/squallms
- Documentation: https://bioconductor.org/packages/release/bioc/vignettes/squallms/inst/doc/squallms.pdf
- License: MIT + file LICENSE
-
Latest release: 1.2.0
published about 1 year ago