Science Score: 59.0%
This score indicates how likely this project is to be science-related based on various indicators:
-
○CITATION.cff file
-
✓codemeta.json file
Found codemeta.json file -
✓.zenodo.json file
Found .zenodo.json file -
✓DOI references
Found 1 DOI reference(s) in README -
✓Academic publication links
Links to: springer.com -
✓Committers with academic emails
35 of 349 committers (10.0%) from academic institutions -
○Institutional organization owner
-
○JOSS paper metadata
-
○Scientific vocabulary similarity
Low similarity (19.6%) to scientific vocabulary
Keywords
data-visualisation
r
visualisation
Keywords from Contributors
grammar
data-manipulation
rmarkdown
package-creation
pandoc
tidyverse
latex
book
tidy-data
literate-programming
Last synced: 10 months ago
·
JSON representation
Repository
An implementation of the Grammar of Graphics in R
Basic Info
- Host: GitHub
- Owner: tidyverse
- License: other
- Language: R
- Default Branch: main
- Homepage: https://ggplot2.tidyverse.org
- Size: 1.17 GB
Statistics
- Stars: 6,763
- Watchers: 299
- Forks: 2,092
- Open Issues: 109
- Releases: 26
Topics
data-visualisation
r
visualisation
Created about 18 years ago
· Last pushed 11 months ago
Metadata Files
Readme
Changelog
Contributing
License
Code of conduct
Governance
README.Rmd
---
output: github_document
---
```{r}
#| echo: false
knitr::opts_chunk$set(
collapse = TRUE,
comment = "#>",
fig.path = "man/figures/README-"
)
```
# ggplot2  [](https://github.com/tidyverse/ggplot2/actions/workflows/R-CMD-check.yaml)
[](https://cran.r-project.org/package=ggplot2)
[](https://app.codecov.io/gh/tidyverse/ggplot2)
## Overview
ggplot2 is a system for declaratively creating graphics, based on [The Grammar of Graphics][gg-book]. You provide the data, tell ggplot2 how to map variables to aesthetics, what graphical primitives to use, and it takes care of the details.
## Installation
```{r}
#| eval: false
# The easiest way to get ggplot2 is to install the whole tidyverse:
install.packages("tidyverse")
# Alternatively, install just ggplot2:
install.packages("ggplot2")
# Or the development version from GitHub:
# install.packages("pak")
pak::pak("tidyverse/ggplot2")
```
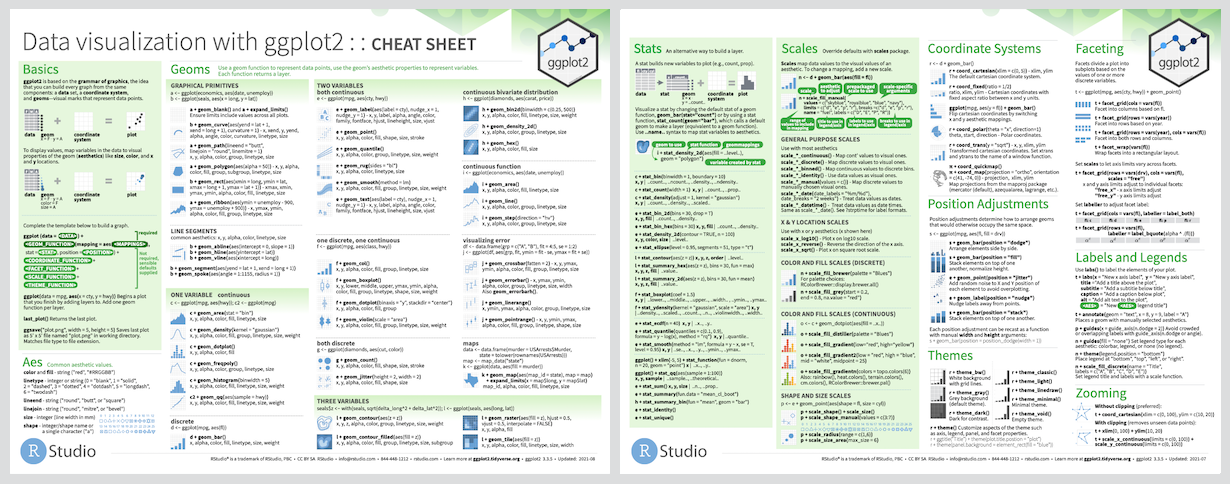
## Cheatsheet
[](https://github.com/tidyverse/ggplot2/actions/workflows/R-CMD-check.yaml)
[](https://cran.r-project.org/package=ggplot2)
[](https://app.codecov.io/gh/tidyverse/ggplot2)
## Overview
ggplot2 is a system for declaratively creating graphics, based on [The Grammar of Graphics][gg-book]. You provide the data, tell ggplot2 how to map variables to aesthetics, what graphical primitives to use, and it takes care of the details.
## Installation
```{r}
#| eval: false
# The easiest way to get ggplot2 is to install the whole tidyverse:
install.packages("tidyverse")
# Alternatively, install just ggplot2:
install.packages("ggplot2")
# Or the development version from GitHub:
# install.packages("pak")
pak::pak("tidyverse/ggplot2")
```
## Cheatsheet
 ## Usage
It's hard to succinctly describe how ggplot2 works because it embodies a deep philosophy of visualisation. However, in most cases you start with `ggplot()`, supply a dataset and aesthetic mapping (with `aes()`). You then add on layers (like `geom_point()` or `geom_histogram()`), scales (like `scale_colour_brewer()`), faceting specifications (like `facet_wrap()`) and coordinate systems (like `coord_flip()`).
```{r}
#| label: example
#| fig.alt: "Scatterplot of engine displacement versus highway miles per
#| gallon, for 234 cars coloured by 7 'types' of car. The displacement and miles
#| per gallon are inversely correlated."
library(ggplot2)
ggplot(mpg, aes(displ, hwy, colour = class)) +
geom_point()
```
## Lifecycle
[](https://lifecycle.r-lib.org/articles/stages.html)
ggplot2 is now over 10 years old and is used by hundreds of thousands of people to make millions of plots. That means, by-and-large, ggplot2 itself changes relatively little. When we do make changes, they will be generally to add new functions or arguments rather than changing the behaviour of existing functions, and if we do make changes to existing behaviour we will do them for compelling reasons.
If you are looking for innovation, look to ggplot2's rich ecosystem of extensions. See a community maintained list at
## Usage
It's hard to succinctly describe how ggplot2 works because it embodies a deep philosophy of visualisation. However, in most cases you start with `ggplot()`, supply a dataset and aesthetic mapping (with `aes()`). You then add on layers (like `geom_point()` or `geom_histogram()`), scales (like `scale_colour_brewer()`), faceting specifications (like `facet_wrap()`) and coordinate systems (like `coord_flip()`).
```{r}
#| label: example
#| fig.alt: "Scatterplot of engine displacement versus highway miles per
#| gallon, for 234 cars coloured by 7 'types' of car. The displacement and miles
#| per gallon are inversely correlated."
library(ggplot2)
ggplot(mpg, aes(displ, hwy, colour = class)) +
geom_point()
```
## Lifecycle
[](https://lifecycle.r-lib.org/articles/stages.html)
ggplot2 is now over 10 years old and is used by hundreds of thousands of people to make millions of plots. That means, by-and-large, ggplot2 itself changes relatively little. When we do make changes, they will be generally to add new functions or arguments rather than changing the behaviour of existing functions, and if we do make changes to existing behaviour we will do them for compelling reasons.
If you are looking for innovation, look to ggplot2's rich ecosystem of extensions. See a community maintained list at
Owner
- Name: tidyverse
- Login: tidyverse
- Kind: organization
- Website: http://tidyverse.org
- Repositories: 43
- Profile: https://github.com/tidyverse
The tidyverse is a collection of R packages that share common principles and are designed to work together seamlessly
GitHub Events
Total
- Create event: 12
- Release event: 1
- Issues event: 485
- Watch event: 299
- Delete event: 5
- Issue comment event: 930
- Push event: 316
- Pull request review comment event: 192
- Pull request review event: 371
- Pull request event: 347
- Fork event: 99
Last Year
- Create event: 12
- Release event: 1
- Issues event: 485
- Watch event: 299
- Delete event: 5
- Issue comment event: 930
- Push event: 316
- Pull request review comment event: 192
- Pull request review event: 371
- Pull request event: 347
- Fork event: 99
Committers
Last synced: about 1 year ago
Top Committers
| Name | Commits | |
|---|---|---|
| hadley | h****m@g****m | 2,275 |
| Winston Chang | w****n@s****g | 589 |
| Teun van den Brand | 4****d | 499 |
| Thomas Lin Pedersen | t****5@g****m | 333 |
| Kohske Takahashi @ jurina | t****e@g****m | 194 |
| Hiroaki Yutani | y****i@g****m | 163 |
| Claus Wilke | w****e@a****u | 99 |
| Jean-Olivier Irisson | i****n@n****g | 60 |
| Lionel Henry | l****y@g****m | 58 |
| Kara Woo | k****o | 52 |
| Dewey Dunnington | d****y@f****t | 47 |
| Kirill Müller | k****r@i****h | 31 |
| Brian Diggs | d****b@o****u | 25 |
| Jake Russ | j****s@g****m | 19 |
| joran | j****s@g****m | 17 |
| Mara Averick | m****k@g****m | 14 |
| Bob Rudis | b****b@r****t | 14 |
| Michael Chirico | c****m@g****m | 13 |
| Jim Hester | j****r@g****m | 12 |
| Josef Fruehwald | J****d@g****m | 12 |
| Elio Campitelli | e****i@g****m | 11 |
| David Kahle | d****d@k****o | 11 |
| Max Kuhn | m****n@g****m | 11 |
| Hassan Kibirige | h****1@g****m | 10 |
| Dana Paige Seidel | d****a@r****m | 10 |
| DanRuderman | r****n@u****u | 7 |
| Jeffrey Arnold | j****d@g****m | 7 |
| olivroy | 5****y | 7 |
| Yunuuuu | y****6@o****m | 7 |
| Kirill Müller | k****r | 7 |
| and 319 more... | ||
Committer Domains (Top 20 + Academic)
mailbox.org: 2
ed.ac.uk: 2
caltech.edu: 2
sund.ku.dk: 2
rstudio.com: 2
openanalytics.eu: 2
gmx.net: 2
lu.lv: 1
ucl.ac.uk: 1
helsinki.fi: 1
nrd.io: 1
ufl.edu: 1
iki.fi: 1
vt.edu: 1
mail.nankai.edu.cn: 1
server.fake: 1
contraflo.ws: 1
coreclarity.net: 1
vanderbilt.edu: 1
bodger.org: 1
umd.edu: 1
stat.ubc.ca: 1
austin.utexas.edu: 1
ivt.baug.ethz.ch: 1
ohsu.edu: 1
usc.edu: 1
umontana.edu: 1
uni-muenster.de: 1
bnl.gov: 1
qatar-med.cornell.edu: 1
aqua.dtu.dk: 1
ntnu.no: 1
sas.upenn.edu: 1
agro.unc.edu.ar: 1
stanford.edu: 1
utexas.edu: 1
bristol.ac.uk: 1
wm.edu: 1
iastate.edu: 1
ucsd.edu: 1
monash.edu: 1
ncbi.nlm.nih.gov: 1
miamioh.edu: 1
stat.rutgers.edu: 1
Issues and Pull Requests
Last synced: 10 months ago
All Time
- Total issues: 914
- Total pull requests: 1,045
- Average time to close issues: about 1 year
- Average time to close pull requests: 2 months
- Total issue authors: 443
- Total pull request authors: 79
- Average comments per issue: 3.08
- Average comments per pull request: 1.44
- Merged pull requests: 756
- Bot issues: 0
- Bot pull requests: 0
Past Year
- Issues: 269
- Pull requests: 401
- Average time to close issues: 15 days
- Average time to close pull requests: 28 days
- Issue authors: 125
- Pull request authors: 32
- Average comments per issue: 1.7
- Average comments per pull request: 1.05
- Merged pull requests: 260
- Bot issues: 0
- Bot pull requests: 0
Top Authors
Issue Authors
- teunbrand (134)
- davidhodge931 (88)
- Yunuuuu (28)
- yutannihilation (16)
- clauswilke (15)
- eliocamp (15)
- thomasp85 (15)
- Breeze-Hu (15)
- hadley (13)
- aphalo (9)
- jbengler (7)
- twest820 (6)
- willgearty (6)
- kylebutts (6)
- schloerke (5)
Pull Request Authors
- teunbrand (787)
- Yunuuuu (29)
- thomasp85 (24)
- yutannihilation (23)
- olivroy (10)
- MichaelChirico (8)
- eliocamp (7)
- yjunechoe (6)
- sierrajohnson (6)
- arcresu (6)
- phispu (6)
- hadley (5)
- zeehio (5)
- steveharoz (4)
- schloerke (4)
Top Labels
Issue Labels
feature (121)
bug (79)
layers :chart_with_upwards_trend: (71)
guides :straight_ruler: (65)
scales :snake: (65)
documentation (63)
internals :mag_right: (57)
themes :dancer: (32)
messages (30)
coord :world_map: (25)
positions :1st_place_medal: (23)
facets :gem: (19)
tidy-dev-day :nerd_face: (18)
visual change 👩🎨 (12)
API change 😈 (9)
breaking change :skull_and_crossbones: (7)
help wanted :heart: (7)
good first issue :heart: (5)
reprex (3)
wip (2)
performance (2)
upkeep (2)
maps :earth_americas: (1)
Pull Request Labels
guides :straight_ruler: (18)
feature (11)
documentation (9)
layers :chart_with_upwards_trend: (6)
breaking change :skull_and_crossbones: (4)
visual change 👩🎨 (3)
bug (2)
internals :mag_right: (2)
scales :snake: (2)
coord :world_map: (1)
maps :earth_americas: (1)
messages (1)
themes :dancer: (1)
API change 😈 (1)
performance (1)
Packages
- Total packages: 2
-
Total downloads:
- cran 1,656,613 last-month
- Total docker downloads: 160,315,077
-
Total dependent packages: 5,268
(may contain duplicates) -
Total dependent repositories: 21,471
(may contain duplicates) - Total versions: 77
- Total maintainers: 1
cran.r-project.org: ggplot2
Create Elegant Data Visualisations Using the Grammar of Graphics
- Homepage: https://ggplot2.tidyverse.org
- Documentation: http://cran.r-project.org/web/packages/ggplot2/ggplot2.pdf
- License: MIT + file LICENSE
-
Latest release: 3.5.2
published over 1 year ago
Rankings
Downloads: 0.0%
Dependent repos count: 0.0%
Dependent packages count: 0.0%
Stargazers count: 0.0%
Forks count: 0.0%
Average: 2.9%
Docker downloads count: 17.3%
Maintainers (1)
Last synced:
10 months ago
proxy.golang.org: github.com/tidyverse/ggplot2
- Documentation: https://pkg.go.dev/github.com/tidyverse/ggplot2#section-documentation
- License: other
-
Latest release: v3.5.2+incompatible
published over 1 year ago
Rankings
Dependent packages count: 6.5%
Average: 6.7%
Dependent repos count: 6.9%
Last synced:
10 months ago
Dependencies
DESCRIPTION
cran
- R >= 3.3 depends
- sp * enhances
- MASS * imports
- cli * imports
- glue * imports
- grDevices * imports
- grid * imports
- gtable >= 0.1.1 imports
- isoband * imports
- lifecycle * imports
- mgcv * imports
- rlang >= 1.0.0 imports
- scales >= 1.2.0 imports
- stats * imports
- tibble * imports
- vctrs >= 0.4.1 imports
- withr >= 2.0.0 imports
- Hmisc * suggests
- RColorBrewer * suggests
- covr * suggests
- dplyr * suggests
- ggplot2movies * suggests
- hexbin * suggests
- knitr * suggests
- lattice * suggests
- mapproj * suggests
- maps * suggests
- maptools * suggests
- multcomp * suggests
- munsell * suggests
- nlme * suggests
- profvis * suggests
- quantreg * suggests
- ragg * suggests
- rgeos * suggests
- rmarkdown * suggests
- rpart * suggests
- sf >= 0.7 suggests
- svglite >= 1.2.0.9001 suggests
- testthat >= 3.1.2 suggests
- vdiffr >= 1.0.0 suggests
- xml2 * suggests
.github/workflows/R-CMD-check.yaml
actions
- actions/checkout v2 composite
- r-lib/actions/check-r-package v2 composite
- r-lib/actions/setup-pandoc v2 composite
- r-lib/actions/setup-r v2 composite
- r-lib/actions/setup-r-dependencies v2 composite
.github/workflows/pkgdown.yaml
actions
- JamesIves/github-pages-deploy-action 4.1.4 composite
- actions/checkout v2 composite
- r-lib/actions/setup-pandoc v2 composite
- r-lib/actions/setup-r v2 composite
- r-lib/actions/setup-r-dependencies v2 composite
.github/workflows/pr-commands.yaml
actions
- actions/checkout v2 composite
- r-lib/actions/pr-fetch v2 composite
- r-lib/actions/pr-push v2 composite
- r-lib/actions/setup-r v2 composite
- r-lib/actions/setup-r-dependencies v2 composite
.github/workflows/test-coverage.yaml
actions
- actions/checkout v2 composite
- r-lib/actions/setup-r v2 composite
- r-lib/actions/setup-r-dependencies v2 composite