Science Score: 10.0%
This score indicates how likely this project is to be science-related based on various indicators:
-
○CITATION.cff file
-
○codemeta.json file
-
○.zenodo.json file
-
○DOI references
-
○Academic publication links
-
✓Committers with academic emails
2 of 4 committers (50.0%) from academic institutions -
○Institutional organization owner
-
○JOSS paper metadata
-
○Scientific vocabulary similarity
Low similarity (14.4%) to scientific vocabulary
Keywords
Repository
Toolkit for comparative metagenomics in EDGE
Basic Info
- Host: GitHub
- Owner: seninp-bioinfo
- Language: R
- Default Branch: master
- Homepage: https://bioedge.lanl.gov/
- Size: 17.5 MB
Statistics
- Stars: 4
- Watchers: 5
- Forks: 2
- Open Issues: 0
- Releases: 0
Topics
Metadata Files
README.md
MetaComp
Metagenome taxonomy assignment comparison toolkit. The toolkit is being developed for EDGE platform and reflects its backend specificity. The routines, however, can be used as a stand-alone library for multi-project comparative visualization of taxonomy assignments obtained for metagenomic samples processed with GOTTCHA/GOTTCHA2, BWA, KRAKEN, METAPHLAN, DIAMOND, or PANGIA. The heatmaps can be also visualized with this D3.js-based code which allows to see the exact abundance values in each cell.


0.0 Installation from CRAN
install.packages("MetaComp")
to use the library, simply load it into R environment:
library(MetaComp)
0.1 Installation from latest sources
install.packages("devtools")
library(devtools)
install_github(repo = 'seninp-bioinfo/MetaComp')
1.0 Reading a single taxonomic assignment files
the_gottcha2_assignment <- load_edge_assignment(data_file_g2, type = 'gottcha2')
the_kraken_assignment <- load_edge_assignment(data_file_k, type = 'kraken')
the_pangia_assignment <- load_edge_assignment(data_file_p, type = 'pangia')
1.1 Reading multiple taxonomic assignment files
The package functions load_xxx_assignments (where xxx stands for gottcha, kraken, or metaphlan) are designed to read a tool-specific assignment files. The configuration file for these functions must be tab-delimeted two columns file where the first column is the project id (used as the project's name in plotting), and the second column is an actual assignment file path:
the_assignments_list_g2 <- load_edge_assignments(config_file_g2, type = 'gottcha2')
the_assignments_list_k <- load_edge_assignments(config_file_k, type = 'kraken')
the_assignments_list_p <- load_edge_assignments(config_file_pangia, type = 'pangia')
2.0 Merging multiple taxonomic assignments into a single table
The merge_edge_assignments function is capable to merge a named list of GOTTCHA, Kraken, or MetaPhlAn assignments into a single table using LEVEL and TAXA columns as ids.
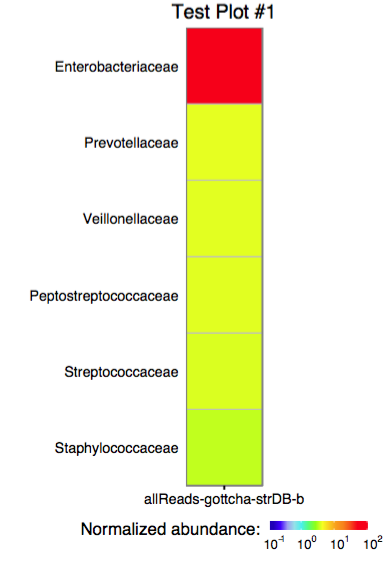
3.0 Plotting a single assignment as a heatmap
The function plot_edge_assignment accepts a single assignment table and outputs a ggplot object or produces a PDF plot using ggplot2's geom_tile.
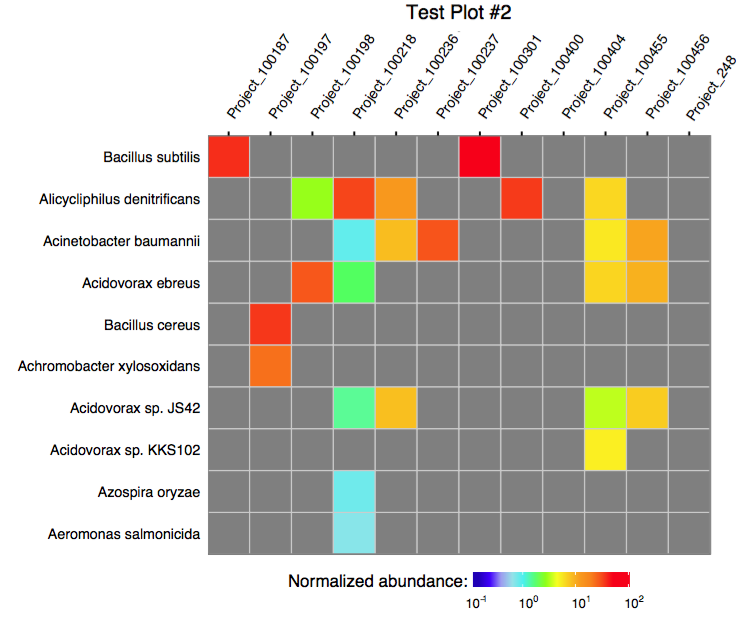
3.1 Plotting multiple assignments as a single heatmap
The function plot_merged_assignment accepts a single merged assignment table as an input and outputs a ggplot object or produces a PDF plot using ggplot2's geom_tile.
4.0. Running merge in a batch mode
The following script can be used to run the merge procedure in a batch mode:
# load library
require(MetaComp)
#
# configure runtime
options(echo = TRUE)
args <- commandArgs(trailingOnly = TRUE)
#
# print provided args
print(paste("provided args: ", args))
#
# acquire values
srcFile <- args[1]
destFile <- args[2]
taxonomyLevelArg <- args[3]
plotTitleArg <- args[4]
plotFileArg <- args[5]
#
# extended functionality was added in the release #3, and we don't want to break the legacy systems
#
if (length(args) > 5) {
    rowLimitArg <- args[6]
    sortingOrderArg <- args[7]
} else {
    rowLimitArg <- 60
    sortingOrderArg <- "abundance"
}
#
# read the data and produce the merged table
merged <- merge_edge_assignments(load_edge_assignments(srcFile, type = "gottcha2"))
#
# write the merge table as a TAB-delimeted file
write.table(merged, file = destFile, col.names = T, row.names = F, quote = T, sep = "\t")
#
# produce a PDF of the merged assignment
plot_merged_assignment(assignment = merged, taxonomy_level = taxonomyLevelArg,
                   sorting_order = sortingOrderArg, row_limit = base::strtoi(rowLimitArg),
                   plot_title = plotTitleArg, filename = plotFileArg)
To execute the scrip, use Rscript as shown below:
$> Rscript merge_and_plot_gottcha_assignments.R assignments_table_gottcha.txt merged_assignments.txt \
                                    family "Merge test plot" merge_test 20 alphabetical
this command line arguments are (some of these are clickable -- so you can see examples):
* Rscript - a way to execute the R script
* merge_and_plot_gottcha_assignments.R- the above script filename
* assignments_table_gottcha.txt - the tab delimeted table of assignments (two columns: project_id TAB assignment_path)
* merged_assignments_gottcha.txt - the tab-delimeted output file name
* family - a LEVEL at which the plot should be produced
* "Merge test plot"- the output plot's title
* merge_test - the output plot filename mask, ".pdf" and ".svg" files will be produced...
* 20 the max number of rows to plot (in the specified sorting order)
* alphabetical the merged plot sorting order
Owner
- Name: seninp-bioinfo
- Login: seninp-bioinfo
- Kind: organization
- Repositories: 12
- Profile: https://github.com/seninp-bioinfo
GitHub Events
Total
Last Year
Committers
Last synced: over 2 years ago
Top Committers
| Name | Commits | |
|---|---|---|
| Pavel Senin | s****p@g****m | 255 |
| Migun Shakya | m****c@g****m | 35 |
| Migun Shakya | m****a@p****v | 9 |
| Pavel Senin | p****n@p****v | 1 |
Committer Domains (Top 20 + Academic)
Issues and Pull Requests
Last synced: 10 months ago
All Time
- Total issues: 5
- Total pull requests: 14
- Average time to close issues: 5 months
- Average time to close pull requests: 10 minutes
- Total issue authors: 2
- Total pull request authors: 2
- Average comments per issue: 0.8
- Average comments per pull request: 0.36
- Merged pull requests: 14
- Bot issues: 0
- Bot pull requests: 0
Past Year
- Issues: 0
- Pull requests: 0
- Average time to close issues: N/A
- Average time to close pull requests: N/A
- Issue authors: 0
- Pull request authors: 0
- Average comments per issue: 0
- Average comments per pull request: 0
- Merged pull requests: 0
- Bot issues: 0
- Bot pull requests: 0
Top Authors
Issue Authors
- seninp (4)
- mshakya (1)
Pull Request Authors
- mshakya (12)
- seninp (2)
Top Labels
Issue Labels
Pull Request Labels
Packages
- Total packages: 1
-
Total downloads:
- cran 262 last-month
- Total docker downloads: 40
- Total dependent packages: 0
- Total dependent repositories: 0
- Total versions: 3
- Total maintainers: 1
cran.r-project.org: MetaComp
EDGE Taxonomy Assignments Visualization
- Homepage: https://github.com/seninp-bioinfo/MetaComp
- Documentation: http://cran.r-project.org/web/packages/MetaComp/MetaComp.pdf
- License: GPL-2
-
Latest release: 1.1.2
published about 8 years ago
Rankings
Maintainers (1)
Dependencies
- R >= 3.1.0 depends
- Cairo * imports
- data.table * imports
- dplyr * imports
- ggplot2 * imports
- plyr * imports
- reshape2 * imports
- testthat * suggests