pRolocGUI
Interactive visualisation and exploration of spatial proteomics data
Science Score: 59.0%
This score indicates how likely this project is to be science-related based on various indicators:
-
○CITATION.cff file
-
✓codemeta.json file
Found codemeta.json file -
✓.zenodo.json file
Found .zenodo.json file -
✓DOI references
Found 2 DOI reference(s) in README -
✓Academic publication links
Links to: nature.com -
✓Committers with academic emails
4 of 24 committers (16.7%) from academic institutions -
○Institutional organization owner
-
○JOSS paper metadata
-
○Scientific vocabulary similarity
Low similarity (11.1%) to scientific vocabulary
Keywords from Contributors
Repository
Interactive visualisation and exploration of spatial proteomics data
Basic Info
- Host: GitHub
- Owner: lgatto
- Language: R
- Default Branch: devel
- Homepage: http://lgatto.github.io/pRolocGUI
- Size: 32 MB
Statistics
- Stars: 8
- Watchers: 3
- Forks: 5
- Open Issues: 12
- Releases: 0
Metadata Files
README.md
Bioconductor build status:
- Devel:  - Release:
Exploring and visualising spatial proteomics data
Introduction
The
pRolocGUI
package is an interactive interface to explore and visualise
experimental mass spectrometry-based spatial proteomics data. It
relies on the shiny framework for
interactive visualisation, the
MSnbase
package to handle data and metadata and the
pRoloc
software for spatial proteomics specific data matters. Example spatial
data is available in the
pRolocdata
experiment package.
The pRoloc suite set of software are distributed as part of the
R/Bioconductor project and are developed
by Lisa Breckels at the Cambridge Centre for Proteomics
at the University of Cambridge and by Laurent Gatto,
director of the Computational Biology and Bioinformatics (CBIO) group
at UCLouvain, in Belgium.
This document describes the installation of the software, followed by
a basic quick start guide for using pRolocGUI to search and
visualise spatial proteomics data. Please refer to the respective
documentation and vignettes for full details about the software.
If you use these open-source software for your research, please cite:
Gatto L, Breckels LM, Wieczorek S, Burger T, Lilley KS. Mass-spectrometry-based spatial proteomics data analysis using pRoloc and pRolocdata. Bioinformatics. 2014 May 1;30(9):1322-4. doi:10.1093/bioinformatics/btu013. Epub 2014 Jan 11. PMID:24413670; PMCID:PMC3998135.
Breckels LM, Gatto L, Christoforou A, Groen AJ, Lilley KS, Trotter MW. The effect of organelle discovery upon sub-cellular protein localisation. J Proteomics. 2013 Mar 21. doi:pii: S1874-3919(13)00094-8. 10.1016/j.jprot.2013.02.019. PMID:23523639.
Gatto L., Breckels L.M., Burger T, Nightingale D.J.H., Groen A.J., Campbell C., Mulvey C.M., Christoforou A., Ferro M., Lilley K.S. 'A foundation for reliable spatial proteomics data analysis' Mol Cell Proteomics. 2014 May 20.
Installation
pRolocGUI is written in the R
programming language. Before installing the software you need to
download R and (optionally) RStudio.
1) Download the latest R release for your operating system from the
R website and install it.
2) Optional, but
recommended. Download
and install the RStudio IDE. RStudio provides a good code editor and
excellent integration with the R terminal.
3) Start R or RStudio.
4) Install the Bioconductor packages pRoloc, pRolocdata and
pRolocGUI:
pRolocGUI requires R >= 3.1.1 and Bioconductor version >= 3.0.
In an R console, type
if (!requireNamespace("BiocManager", quietly=TRUE))
    install.packages("BiocManager")
BiocManager::install(c("pRoloc", "pRolocdata", "pRolocGUI"))
Development version
The development code on github can also be installed using
BiocManager::install (or install_github). New pre-release features
might not be documented or thoroughly tested and could substantially
change prior to release. Use at your own risks.
BiocManager::install("ComputationalProteomicsUnit/pRolocGUI")
Getting started
Before using a package's functionality, it needs to be loaded:
library("pRolocGUI")
We first load data from
Christoforou et al 2016
distributed in the pRolocdata package:
library("pRolocdata")
data(hyperLOPIT2015)
There are 3 different visualisation applications currently
available: explore, compare and aggregate.
These apps are launched using the pRolocVis function and
passing object, which is an MSnSet containing the data
one wishes to interrogate. One may also specify which app
they wish to use by using the app argument, see ?pRolocVis
for more details. The default app that is loaded if
app is not specified is the explore application:
pRolocVis(hyperLOPIT2015)
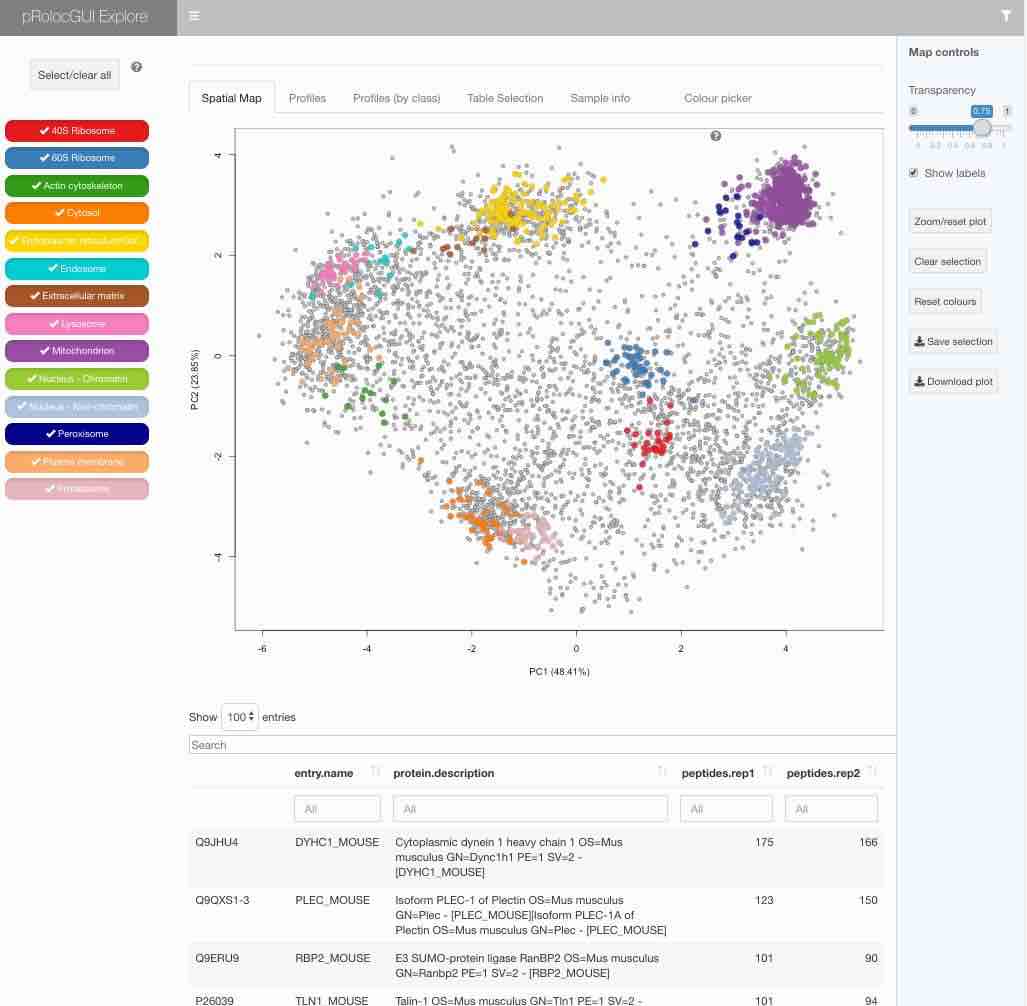
The graphical interface is described in details in the package
vignette that is included in the package itself (get it by typing
vignette("pRolocGUI") in R), available by clicking the ? once
the interface is loaded or can be
consulted online.
More resources
Support
- The Bioconductor support forum
- Open a
pRolocGUIGitHub issue (requires a free GitHub account).
Videos (new videos will appear shortly for the new apps)
- An introduction to Bioconductor
- A brief introduction to
pRolocGUI - Downloading and install
R - Using RStudio
- Installing the
pRolocGUIinterface - Starting
pRolocGUI- This tutorial is for the older legacy applications. New videos will appear shortly for the new applications. - Using
pRolocGUIto explore and visualise experimental spatial proteomics data - This tutorial is for the older legacy applications. New videos will appear shortly for the new applications.
Tutorial playlist.
General resources
- Teaching material
- R and Bioconductor for proteomics web page and package.
Owner
- Name: Laurent Gatto
- Login: lgatto
- Kind: user
- Location: Belgium
- Company: de Duve Institute, UCLouvain
- Website: https://fosstodon.org/@lgatto
- Repositories: 98
- Profile: https://github.com/lgatto
Open science, reproducible research, bioinformatics, computational biology, proteomics, more omics, emacs, a lot of R, running and parenting.
GitHub Events
Total
- Issues event: 1
- Watch event: 1
- Delete event: 2
- Push event: 10
- Pull request event: 1
- Create event: 1
Last Year
- Issues event: 1
- Watch event: 1
- Delete event: 2
- Push event: 10
- Pull request event: 1
- Create event: 1
Committers
Last synced: about 1 year ago
Top Committers
| Name | Commits | |
|---|---|---|
| *tnaake* | t****e@g****e | 377 |
| Laurent | l****0@c****k | 233 |
| lmsimp | l****p@g****m | 214 |
| l.gatto | l****o@b****8 | 128 |
| Laurent Gatto | l****o@d****e | 120 |
| Laurent Gatto | l****o@u****e | 44 |
| Lisa Breckels | l****a@L****e | 21 |
| Nitesh Turaga | n****a@g****m | 14 |
| d.tenenbaum | d****m@b****8 | 14 |
| Dan Tenenbaum | d****a@f****g | 11 |
| J Wokaty | j****y@s****u | 10 |
| hpages@fhcrc.org | h****s@f****g@b****8 | 4 |
| Herve Pages | h****s@f****g | 4 |
| vobencha | v****a@g****m | 2 |
| Hervé Pagès | h****s@f****g | 2 |
| vobencha | v****n@r****g | 2 |
| A Wokaty | a****y@s****u | 2 |
| pierremj | p****j@p****u | 1 |
| m.carlson | m****n@b****8 | 1 |
| Marc Carlson | m****n@f****g | 1 |
| James Hester | j****r@f****g | 1 |
| *tnaake* | *****e@g****e | 1 |
| LiNk-NY | m****9@g****m | 1 |
| j.hester | j****r@b****8 | 1 |
Committer Domains (Top 20 + Academic)
Issues and Pull Requests
Last synced: 10 months ago
All Time
- Total issues: 114
- Total pull requests: 7
- Average time to close issues: 6 months
- Average time to close pull requests: about 2 hours
- Total issue authors: 9
- Total pull request authors: 2
- Average comments per issue: 2.11
- Average comments per pull request: 0.86
- Merged pull requests: 6
- Bot issues: 0
- Bot pull requests: 0
Past Year
- Issues: 2
- Pull requests: 1
- Average time to close issues: 20 days
- Average time to close pull requests: less than a minute
- Issue authors: 2
- Pull request authors: 1
- Average comments per issue: 1.5
- Average comments per pull request: 0.0
- Merged pull requests: 1
- Bot issues: 0
- Bot pull requests: 0
Top Authors
Issue Authors
- lmsimp (64)
- lgatto (34)
- Kohze (4)
- tnaake (3)
- blue-moon22 (3)
- dan-night-89 (2)
- kbarylyuk (2)
- rdogra8 (1)
- TomSmithCGAT (1)
Pull Request Authors
- lmsimp (6)
- pierremj (2)
Top Labels
Issue Labels
Pull Request Labels
Packages
- Total packages: 1
-
Total downloads:
- bioconductor 24,801 total
- Total dependent packages: 0
- Total dependent repositories: 0
- Total versions: 5
- Total maintainers: 1
bioconductor.org: pRolocGUI
Interactive visualisation of spatial proteomics data
- Homepage: https://github.com/lgatto/pRolocGUI
- Documentation: https://bioconductor.org/packages/release/bioc/vignettes/pRolocGUI/inst/doc/pRolocGUI.pdf
- License: GPL-2
-
Latest release: 2.18.0
published about 1 year ago
Rankings
Maintainers (1)
Dependencies
- Biobase * depends
- MSnbase >= 2.1.11 depends
- R >= 3.1.0 depends
- methods * depends
- pRoloc >= 1.27.6 depends
- BiocGenerics * imports
- DT >= 0.1.40 imports
- colorspace * imports
- colourpicker * imports
- dplyr * imports
- ggplot2 * imports
- grDevices * imports
- graphics * imports
- grid * imports
- scales * imports
- shiny >= 0.9.1 imports
- shinyWidgets * imports
- shinydashboard * imports
- shinydashboardPlus >= 2.0.0 imports
- shinyhelper * imports
- shinyjs * imports
- stats * imports
- utils * imports
- BiocStyle >= 2.5.19 suggests
- knitr * suggests
- pRolocdata * suggests
- rmarkdown * suggests