SHAPforxgboost
SHAP (SHapley Additive exPlnation) visualization for 'XGBoost' in 'R'
Science Score: 33.0%
This score indicates how likely this project is to be science-related based on various indicators:
-
○CITATION.cff file
-
○codemeta.json file
-
○.zenodo.json file
-
✓DOI references
Found 2 DOI reference(s) in README -
✓Academic publication links
Links to: arxiv.org -
✓Committers with academic emails
1 of 4 committers (25.0%) from academic institutions -
○Institutional organization owner
-
○JOSS paper metadata
-
○Scientific vocabulary similarity
Low similarity (15.6%) to scientific vocabulary
Repository
SHAP (SHapley Additive exPlnation) visualization for 'XGBoost' in 'R'
Basic Info
- Host: GitHub
- Owner: liuyanguu
- License: other
- Language: R
- Default Branch: master
- Homepage: https://liuyanguu.github.io/SHAPforxgboost/
- Size: 14.8 MB
Statistics
- Stars: 122
- Watchers: 6
- Forks: 22
- Open Issues: 6
- Releases: 4
Metadata Files
README.md
SHAPforxgboost 

This package creates SHAP (SHapley Additive exPlanation) visualization plots for 'XGBoost' in R. It provides summary plot, dependence plot, interaction plot, and force plot. It relies on the SHAP implementation provided by 'XGBoost' and 'LightGBM'. Please refer to 'slundberg/shap' for the original implementation of SHAP in Python. Please note that the SHAP values are generated by 'XGBoost' and 'LightGBM'; we just plot them. So the package cannot be used directly for other tree models like the random forest. Please refer to the "Note on the package" for more details.
All the functions except the force plot return ggplot object thus it is possible to add more layers. The dependence plot shap.plot.dependence returns ggplot object if without the marginal histogram by default.
To revise feature names, you could define a global variable named new_labels, the plotting functions will use this list as new feature labels. The SHAPforxgboost::new_labels is a placeholder default to NULL. Or you could overwrite the labels by adding a labs layer to the ggplot object.
Please refer to this blog as the vignette: more examples and discussion on SHAP values in R, why use SHAP, and a comparison to Gain: SHAP visualization for XGBoost in R
Installation
Please install from CRAN or Github:
r
install.packages("SHAPforxgboost")
r
devtools::install_github("liuyanguu/SHAPforxgboost")
Example
Summary plot
```{r}
run the model with built-in data, these codes can run directly if package installed
library("SHAPforxgboost") yvar <- "diffcwv" dataX <- as.matrix(dataXYdf[,-..y_var])
hyperparameter tuning results
params <- list(objective = "reg:squarederror", # For regression eta = 0.02, maxdepth = 10, gamma = 0.01, subsample = 0.98, colsamplebytree = 0.86)
mod <- xgboost::xgboost(data = dataX, label = as.matrix(dataXYdf[[yvar]]), params = params, nrounds = 200, verbose = FALSE, earlystoppingrounds = 8)
To return the SHAP values and ranked features by mean|SHAP|
shapvalues <- shap.values(xgbmodel = mod, X_train = dataX)
The ranked features by mean |SHAP|
shapvalues$meanshap_score
To prepare the long-format data:
shaplong <- shap.prep(xgbmodel = mod, X_train = dataX)
is the same as: using given shap_contrib
shaplong <- shap.prep(shapcontrib = shapvalues$shapscore, X_train = dataX)
(Notice that there will be a data.table warning from melt.data.table due to dayint coerced from
integer to double)
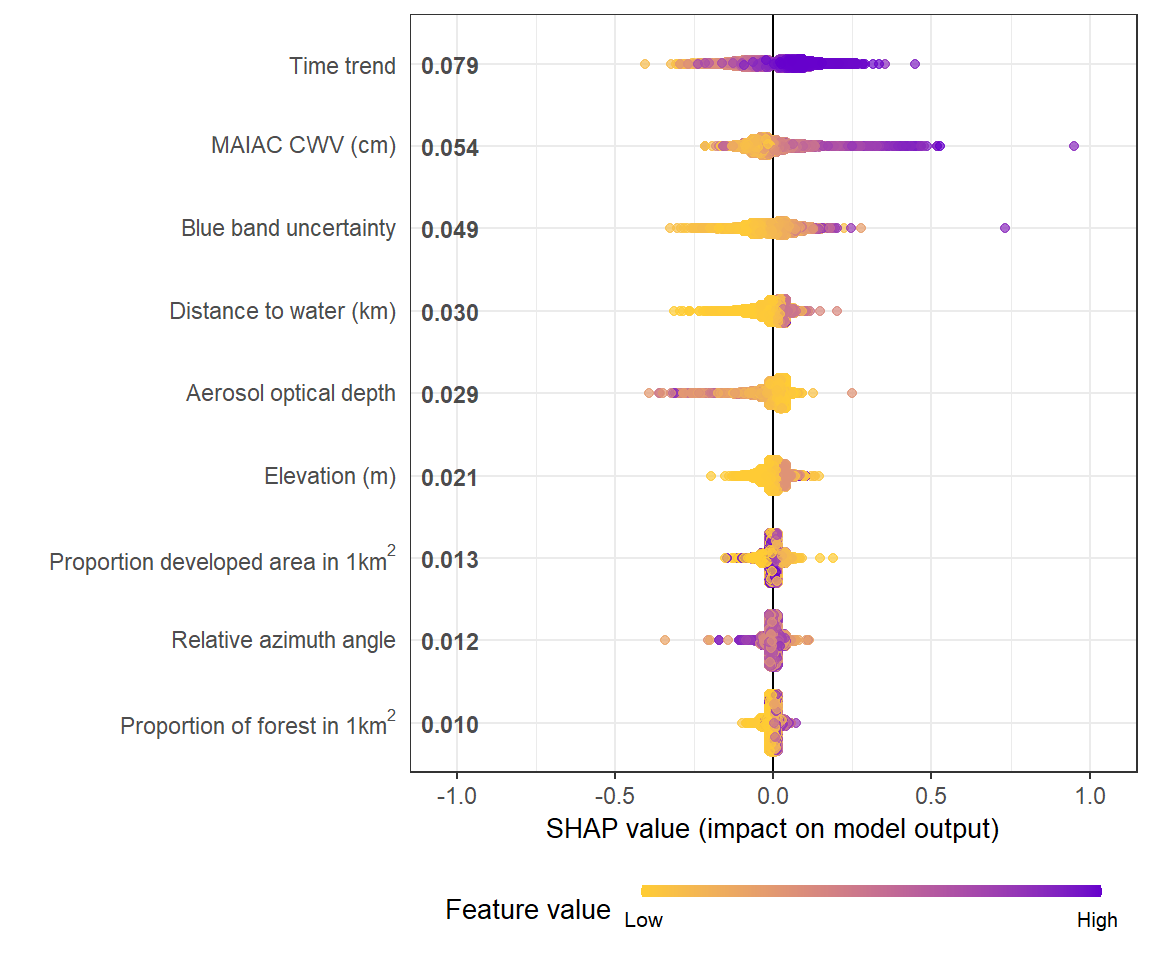
SHAP summary plot
shap.plot.summary(shap_long)
sometimes for a preview, you want to plot less data to make it faster using dilute
shap.plot.summary(shaplong, xbound = 1.2, dilute = 10)
Alternatives options to make the same plot:
option 1: start with the xgboost model
shap.plot.summary.wrap1(mod, X = dataX)
option 2: supply a self-made SHAP values dataset (e.g. sometimes as output from cross-validation)
shap.plot.summary.wrap2(shapvalues$shapscore, dataX)
```
Dependence plot
```{r}
SHAP dependence plot
if without y, will just plot SHAP values of x vs. x
shap.plot.dependence(datalong = shaplong, x = "dayint")
optional to color the plot by assigning color_feature (Fig.A)
shap.plot.dependence(datalong = shaplong, x= "dayint", colorfeature = "ColumnWV")
optional to put a different SHAP values on the y axis to view some interaction (Fig.B)
shap.plot.dependence(datalong = shaplong, x= "dayint", y = "ColumnWV", colorfeature = "Column_WV")
```
```{r}
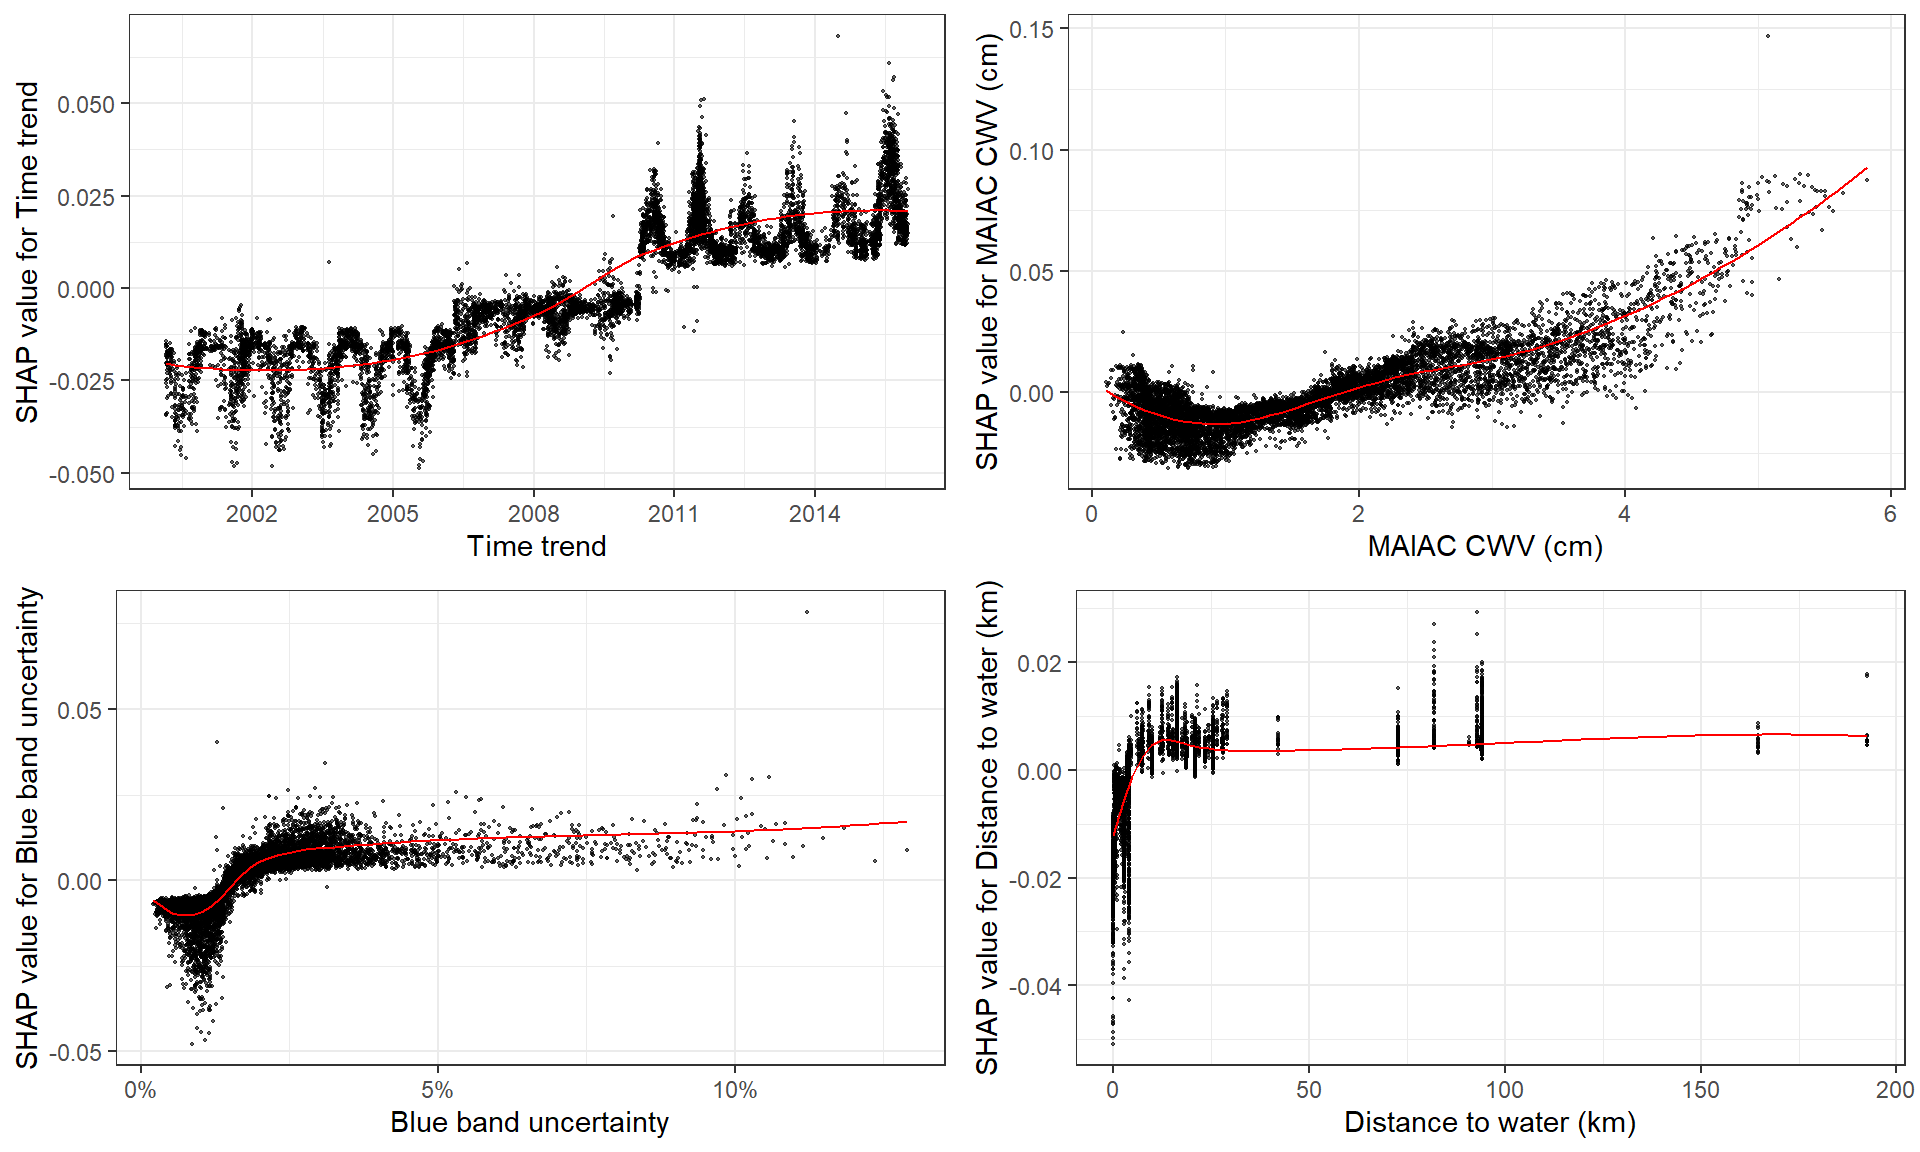
To make plots for a group of features:
figlist = lapply(names(shapvalues$meanshapscore)[1:6], shap.plot.dependence, datalong = shaplong, dilute = 5) gridExtra::grid.arrange(grobs = fig_list, ncol = 2) ```
SHAP interaction plot
This example will take very long, don't run it, try a small dataset or check the example in shap.prep.interaction.
```{r}
prepare the data using either:
notice: this step is slow since it calculates all the combinations of features.
It may take very long on personal laptop.
shapint <- shap.prep.interaction(xgbmod = mod, X_train = dataX)
it is the same as:
shap_int <- predict(mod, dataX, predinteraction = TRUE)
*SHAP interaction effect plot *
shap.plot.dependence(datalong = shaplong, dataint = shapint, x= "ColumnWV", y = "AOTUncertainty", colorfeature = "AOTUncertainty") ```
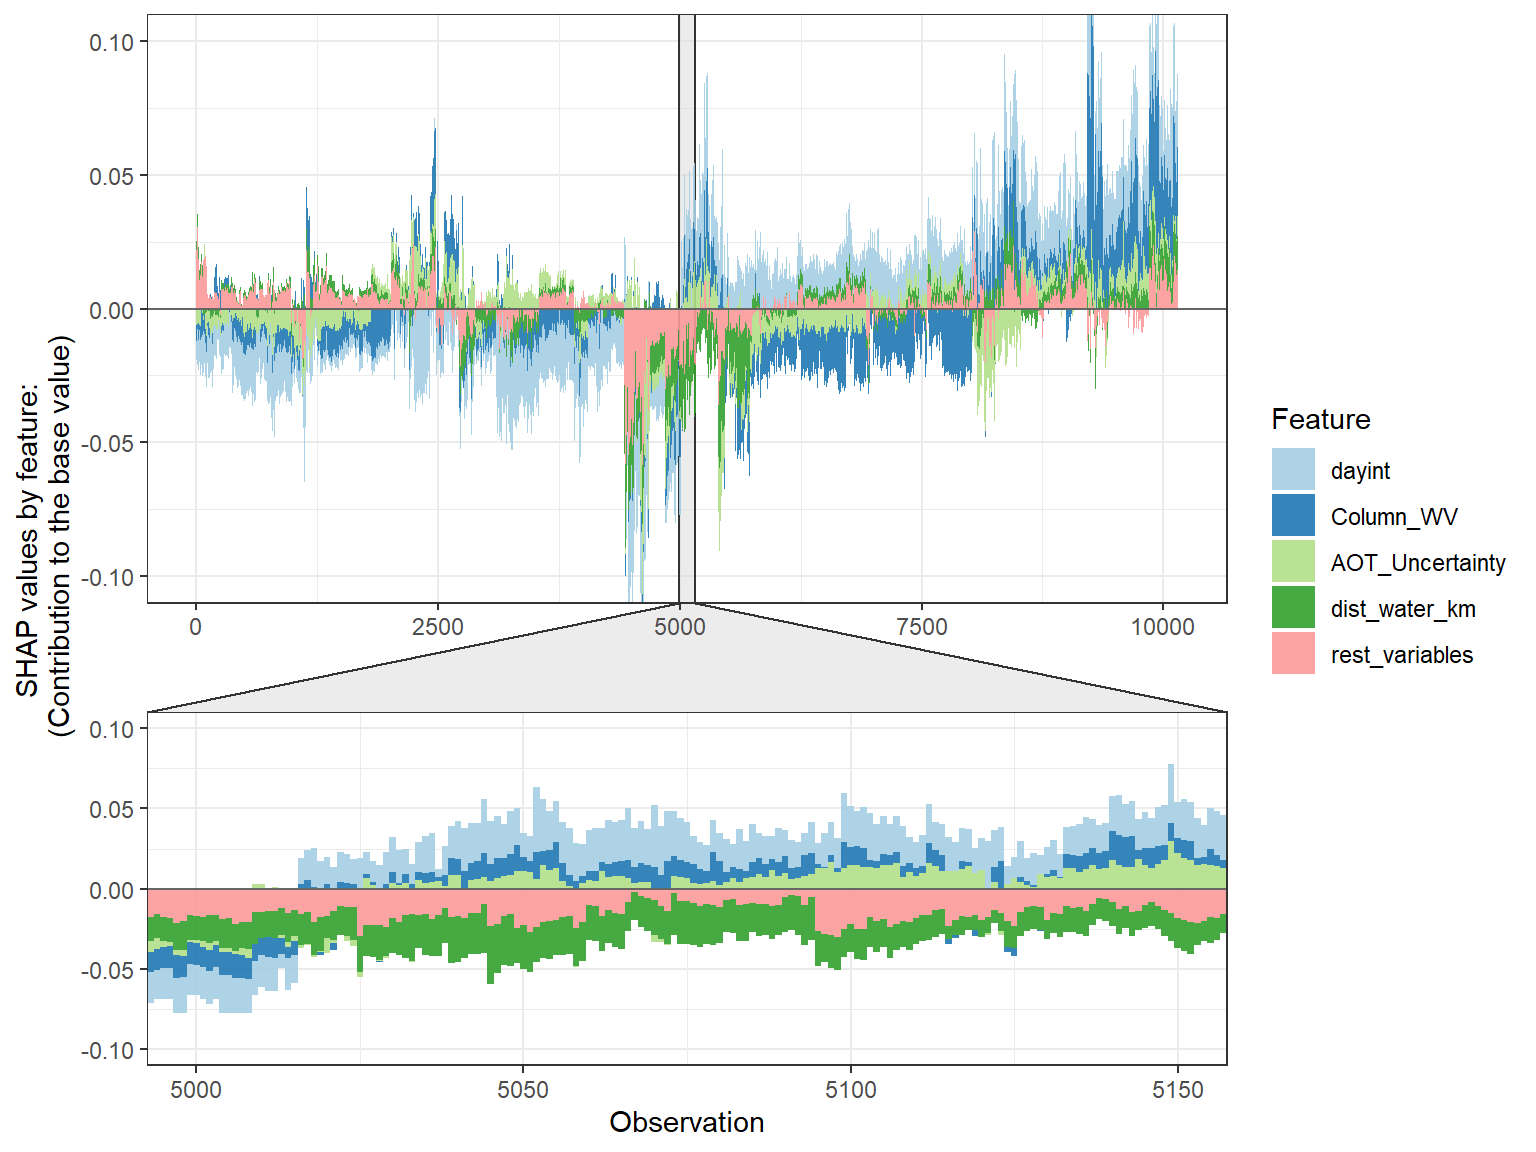
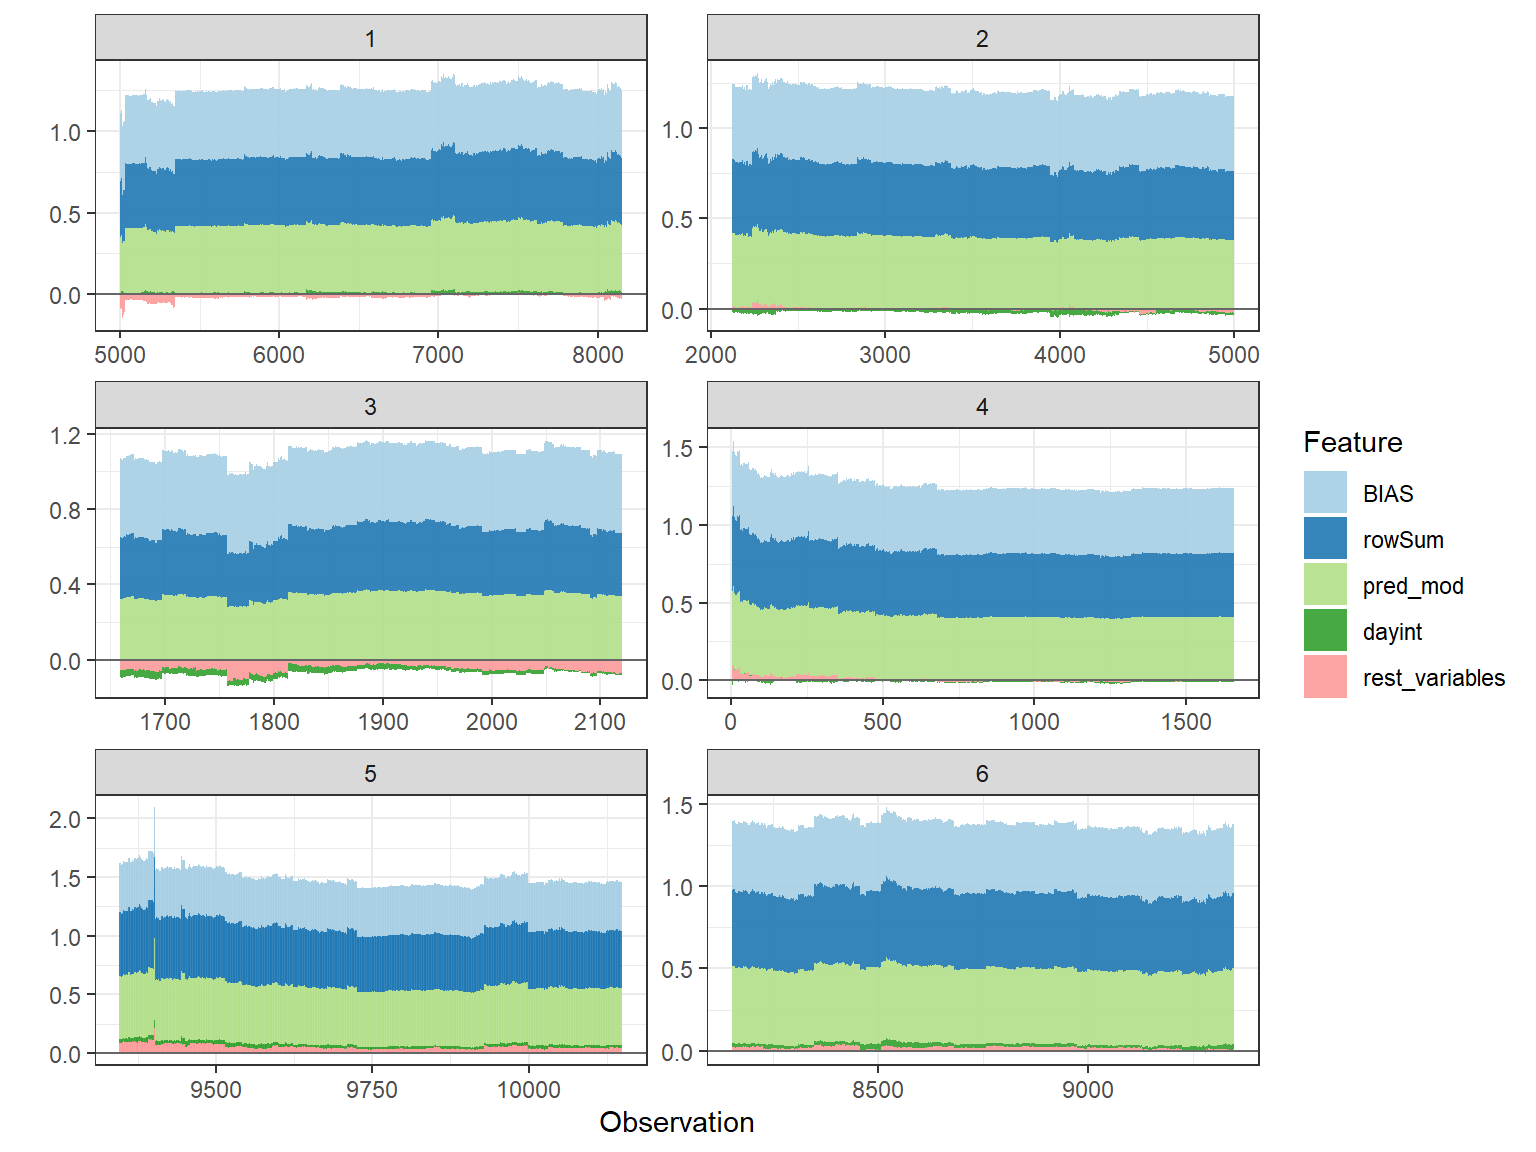
SHAP force plot
```{r}
choose to show top 4 features by setting top_n = 4, set 6 clustering groups.
plotdata <- shap.prep.stack.data(shapcontrib = shapvalues$shapscore, topn = 4, ngroups = 6)
choose to zoom in at location 500, set y-axis limit using y_parent_limit
it is also possible to set y-axis limit for zoom-in part alone using y_zoomin_limit
shap.plot.forceplot(plotdata, zoominlocation = 500, yparentlimit = c(-1,1))
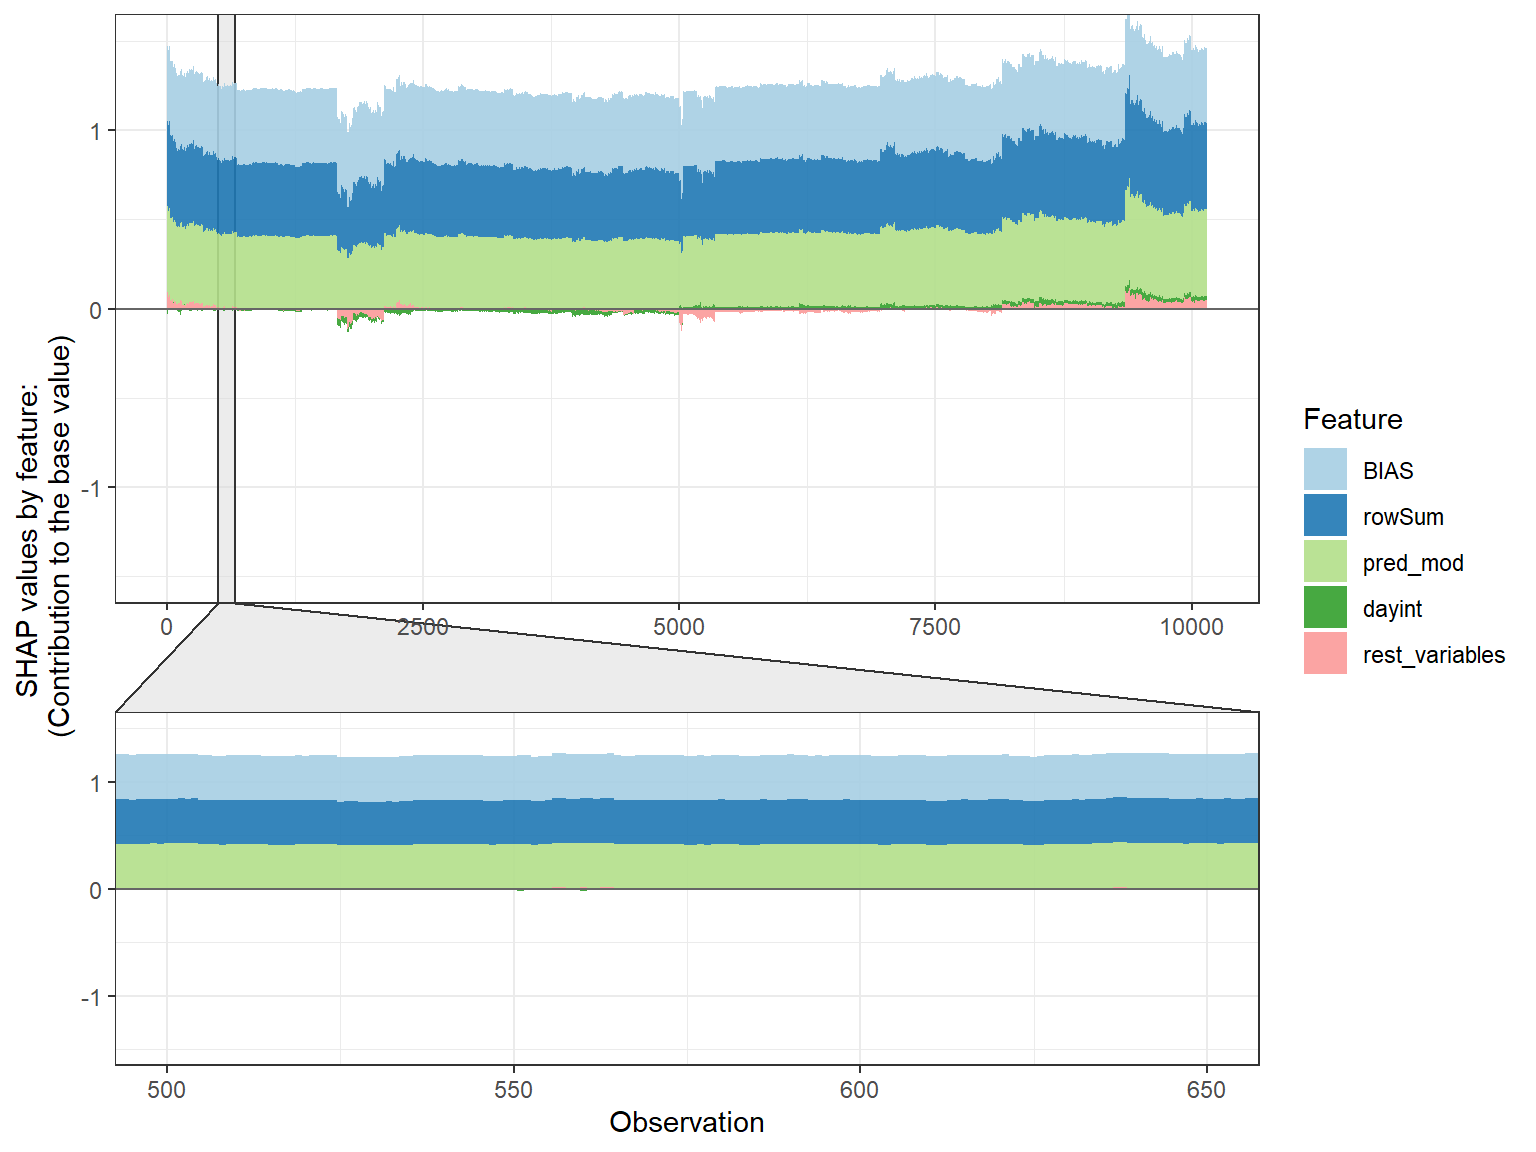
plot by each cluster
shap.plot.forceplotbygroup(plot_data)
```
Note on the package
SHAP values
SHAPforxgboost plots the SHAP values returned by the predict function. The shap.values function obtains SHAP values using:
predict(object = xgb_model, newdata = X_train, predcontrib = TRUE)
If you are using 'XGBoost', see ?xgboost::predict.xgb.Booster for more details. If you are new to SHAP plot, it may be a good idea to try the examples in the default SHAP plotting function in the 'XGBoost' package first:
?xgboost::xgb.plot.shap
Cross-validation
Although the function shap.values names the parameter X_train, it is just the data you would provide to the predict function together with the xgboost model object to make predictions. So it can be training data or testing data. SHAP values help to explain how the model works and how each feature contributes to the predicted values.
As an example of feature selection using SHAP values: if uses 5-fold cross-validation, for each round, the model is fit using 4/5 of the data, then the predictions are obtained using the 1/5 withheld data. Then SHAP values are obtained for these 1/5 testing data. After the 5 iterations, we combine the 5 groups of SHAP values (just like how we obtain the overall yhat) for the 5 folds to get SHAP values in the same dimension as the dataX and can use SHAP values to rank feature importance. Hyper-parameter tuning of the model is performed separately in each round of cross-validation.
Citation
The citation could be seen obtained using citation("SHAPforxgboost")
```{r} To cite package ‘SHAPforxgboost’ in publications use:
Yang Liu and Allan Just (2020). SHAPforxgboost: SHAP Plots for 'XGBoost'. R package version 0.1.0. https://github.com/liuyanguu/SHAPforxgboost/
A BibTeX entry for LaTeX users is
@Manual{, title = {SHAPforxgboost: SHAP Plots for 'XGBoost'}, author = {Yang Liu and Allan Just}, year = {2020}, note = {R package version 0.1.0}, url = {https://github.com/liuyanguu/SHAPforxgboost/}, } ```
Reference
Our lab's paper applying this package:
Gradient Boosting Machine Learning to Improve Satellite-Derived Column Water Vapor Measurement Error
Corresponding SHAP plots package in Python: https://github.com/slundberg/shap
Paper 1. 2017 A Unified Approach to Interpreting Model Predictions
Paper 2. 2019 Consistent Individualized Feature Attribution for Tree Ensembles
Paper 3. 2019 Explainable AI for Trees: From Local Explanations to Global Understanding
Owner
- Name: Yang Liu
- Login: liuyanguu
- Kind: user
- Location: New York
- Company: @UNICEF @unicef-drp @justlab
- Website: https://liuyanguu.github.io
- Repositories: 6
- Profile: https://github.com/liuyanguu
Statistician
GitHub Events
Total
- Issues event: 1
- Watch event: 19
- Fork event: 1
Last Year
- Issues event: 1
- Watch event: 19
- Fork event: 1
Committers
Last synced: over 2 years ago
Top Committers
| Name | Commits | |
|---|---|---|
| liuyanguu | l****o@g****m | 70 |
| mayer79 | m****9@g****m | 16 |
| Liu | y****2@m****u | 2 |
| Fabian Schmidt | f****s@o****m | 1 |
Committer Domains (Top 20 + Academic)
Issues and Pull Requests
Last synced: 10 months ago
All Time
- Total issues: 31
- Total pull requests: 11
- Average time to close issues: 7 months
- Average time to close pull requests: 3 months
- Total issue authors: 27
- Total pull request authors: 4
- Average comments per issue: 2.9
- Average comments per pull request: 1.0
- Merged pull requests: 9
- Bot issues: 0
- Bot pull requests: 0
Past Year
- Issues: 1
- Pull requests: 0
- Average time to close issues: N/A
- Average time to close pull requests: N/A
- Issue authors: 1
- Pull request authors: 0
- Average comments per issue: 0.0
- Average comments per pull request: 0
- Merged pull requests: 0
- Bot issues: 0
- Bot pull requests: 0
Top Authors
Issue Authors
- MJimitater (3)
- mayer79 (2)
- arupakaa (2)
- ferrenlove (1)
- learning-freak (1)
- liuyanguu (1)
- aishameriane (1)
- albertiniufu (1)
- JRatschat (1)
- ChenTaHung (1)
- Slangevar (1)
- vspinu (1)
- hclimente (1)
- MatticeV (1)
- jameslamb (1)
Pull Request Authors
- mayer79 (9)
- smidtfab (1)
- gdupret (1)
- yfyang86 (1)
Top Labels
Issue Labels
Pull Request Labels
Packages
- Total packages: 1
-
Total downloads:
- cran 2,629 last-month
- Total dependent packages: 0
- Total dependent repositories: 1
- Total versions: 7
- Total maintainers: 1
cran.r-project.org: SHAPforxgboost
SHAP Plots for 'XGBoost'
- Homepage: https://github.com/liuyanguu/SHAPforxgboost
- Documentation: http://cran.r-project.org/web/packages/SHAPforxgboost/SHAPforxgboost.pdf
- License: MIT + file LICENSE
-
Latest release: 0.1.3
published about 3 years ago
Rankings
Maintainers (1)
Dependencies
- R >= 3.5.0 depends
- BBmisc * imports
- RColorBrewer >= 1.1.2 imports
- data.table >= 1.12.0 imports
- ggExtra >= 0.8 imports
- ggforce >= 0.2.1.9000 imports
- ggplot2 >= 3.0.0 imports
- ggpubr * imports
- stats * imports
- xgboost >= 0.81.0.0 imports
- gridExtra >= 2.3 suggests
- here * suggests
- knitr * suggests
- lightgbm >= 2.1 suggests
- parallel * suggests
- rmarkdown * suggests