ROCR
An R package for visualizing classifier performance (Sing/Sander/Beerenwinkel/Lengauer [2005] Bioinformatics)
Science Score: 23.0%
This score indicates how likely this project is to be science-related based on various indicators:
-
○CITATION.cff file
-
✓codemeta.json file
Found codemeta.json file -
○.zenodo.json file
-
○DOI references
-
○Academic publication links
-
✓Committers with academic emails
2 of 9 committers (22.2%) from academic institutions -
○Institutional organization owner
-
○JOSS paper metadata
-
○Scientific vocabulary similarity
Low similarity (13.4%) to scientific vocabulary
Repository
An R package for visualizing classifier performance (Sing/Sander/Beerenwinkel/Lengauer [2005] Bioinformatics)
Basic Info
- Host: GitHub
- Owner: ipa-tys
- Language: R
- Default Branch: master
- Homepage: http://rocr.bioinf.mpi-sb.mpg.de/
- Size: 5.79 MB
Statistics
- Stars: 39
- Watchers: 2
- Forks: 11
- Open Issues: 3
- Releases: 0
Metadata Files
README.md
ROCR 
 <!-- badges: end -->
visualizing classifier performance in R, with only 3 commands
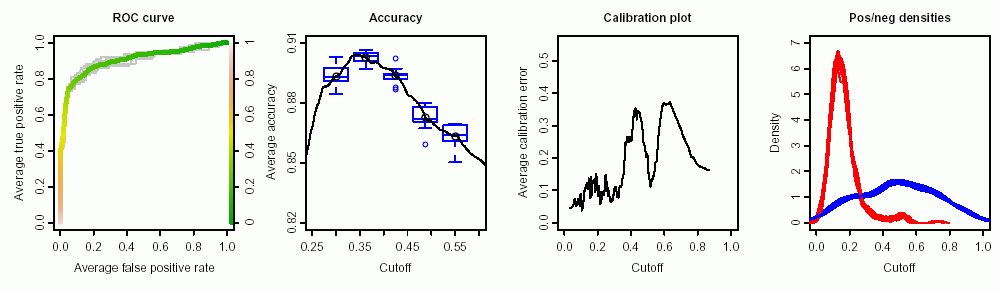
Please support our work by citing the ROCR article in your publications:
Sing T, Sander O, Beerenwinkel N, Lengauer T. [2005] ROCR: visualizing classifier performance in R. Bioinformatics 21(20):3940-1.
Free full text: http://bioinformatics.oxfordjournals.org/content/21/20/3940.full

ROCR was originally developed at the Max Planck Institute for Informatics
Introduction
ROCR (with obvious pronounciation) is an R package for evaluating and visualizing classifier performance. It is...
- ...easy to use: adds only three new commands to R.
- ...flexible: integrates tightly with R's built-in graphics facilities.
- ...powerful: Currently, 28 performance measures are implemented, which can be freely combined to form parametric curves such as ROC curves, precision/recall curves, or lift curves. Many options such as curve averaging (for cross-validation or bootstrap), augmenting the averaged curves by standard error bar or boxplots, labeling cutoffs to the curve, or coloring curves according to cutoff.
Performance measures that ROCR knows:
Accuracy, error rate, true positive rate, false positive rate, true negative rate, false negative rate, sensitivity, specificity, recall, positive predictive value, negative predictive value, precision, fallout, miss, phi correlation coefficient, Matthews correlation coefficient, mutual information, chi square statistic, odds ratio, lift value, precision/recall F measure, ROC convex hull, area under the ROC curve, precision/recall break-even point, calibration error, mean cross-entropy, root mean squared error, SAR measure, expected cost, explicit cost.
ROCR features:
ROC curves, precision/recall plots, lift charts, cost curves, custom curves by freely selecting one performance measure for the x axis and one for the y axis, handling of data from cross-validation or bootstrapping, curve averaging (vertically, horizontally, or by threshold), standard error bars, box plots, curves that are color-coded by cutoff, printing threshold values on the curve, tight integration with Rs plotting facilities (making it easy to adjust plots or to combine multiple plots), fully customizable, easy to use (only 3 commands).
Installation of ROCR
The most straightforward way to install and use ROCR is to install it from
CRAN by starting R and using the install.packages function:
install.packages("ROCR")
Alternatively you can install it from command line using the tar ball like this:
R CMD INSTALL ROCR_*.tar.gz
Getting started
from within R ...
library(ROCR)
demo(ROCR)
help(package=ROCR)
Examples
Using ROCR's 3 commands to produce a simple ROC plot:
pred <- prediction(predictions, labels)
perf <- performance(pred, measure = "tpr", x.measure = "fpr")
plot(perf, col=rainbow(10))
Documentation
- The Reference Manual found here
- Slide deck for a tutorial talk (feel free to re-use for teaching, but please give appropriate credits and write us an email) [PPT]
- A few pointers to the literature on classifier evaluation
Contact
Questions, comments, and suggestions are very welcome. Open an issue on GitHub and we can discuss. We are also interested in seeing how ROCR is used in publications. Thus, if you have prepared a paper using ROCR we'd be happy to know.
Owner
- Name: Tobias Sing
- Login: ipa-tys
- Kind: user
- Repositories: 29
- Profile: https://github.com/ipa-tys
GitHub Events
Total
- Watch event: 1
Last Year
- Watch event: 1
Committers
Last synced: over 1 year ago
Top Committers
| Name | Commits | |
|---|---|---|
| FelixErnst | f****t@o****m | 76 |
| Tobias Sing | l****e@g****m | 8 |
| Tobias Sing | t****g@m****e | 5 |
| Tobias Sing | t****g@g****m | 4 |
| Untom | u****r@b****t | 1 |
| Mehera Emrich | 7****h | 1 |
| tys | t****s@u****n | 1 |
| Tobias Sing | t****s@i****e | 1 |
| Billy Aung Myint | r@u****m | 1 |
Committer Domains (Top 20 + Academic)
Issues and Pull Requests
Last synced: 11 months ago
All Time
- Total issues: 13
- Total pull requests: 4
- Average time to close issues: 12 months
- Average time to close pull requests: over 4 years
- Total issue authors: 13
- Total pull request authors: 3
- Average comments per issue: 1.85
- Average comments per pull request: 2.25
- Merged pull requests: 2
- Bot issues: 0
- Bot pull requests: 0
Past Year
- Issues: 0
- Pull requests: 0
- Average time to close issues: N/A
- Average time to close pull requests: N/A
- Issue authors: 0
- Pull request authors: 0
- Average comments per issue: 0
- Average comments per pull request: 0
- Merged pull requests: 0
- Bot issues: 0
- Bot pull requests: 0
Top Authors
Issue Authors
- Xdai8923 (1)
- drdataking (1)
- tjebo (1)
- middeleast20 (1)
- fuehrding (1)
- olapuentesantana (1)
- asantucci (1)
- wiebkedrews (1)
- higgi13425 (1)
- CHENGHAO-WANG (1)
- GautamBuddha (1)
- eipi10 (1)
- HywelMJ (1)
Pull Request Authors
- untom (2)
- meemrich (1)
- burkovae (1)
Top Labels
Issue Labels
Pull Request Labels
Packages
- Total packages: 1
-
Total downloads:
- cran 59,128 last-month
- Total docker downloads: 345,209
- Total dependent packages: 93
- Total dependent repositories: 400
- Total versions: 8
- Total maintainers: 1
cran.r-project.org: ROCR
Visualizing the Performance of Scoring Classifiers
- Homepage: http://ipa-tys.github.io/ROCR/
- Documentation: http://cran.r-project.org/web/packages/ROCR/ROCR.pdf
- License: GPL-2 | GPL-3 [expanded from: GPL (≥ 2)]
-
Latest release: 1.0-11
published about 6 years ago
Rankings
Maintainers (1)
Dependencies
- R >= 3.6 depends
- gplots * imports
- grDevices * imports
- graphics * imports
- methods * imports
- stats * imports
- knitr * suggests
- rmarkdown * suggests
- testthat * suggests
- actions/cache v1 composite
- actions/checkout v2 composite
- actions/upload-artifact master composite
- r-lib/actions/setup-pandoc master composite
- r-lib/actions/setup-r master composite
- actions/cache v1 composite
- actions/checkout v2 composite
- r-lib/actions/setup-pandoc master composite
- r-lib/actions/setup-r master composite