DGM
Dynamical graphical models for multivariate time series data to estimate directed dynamic relationships in networks.
Science Score: 23.0%
This score indicates how likely this project is to be science-related based on various indicators:
-
○CITATION.cff file
-
○codemeta.json file
-
○.zenodo.json file
-
✓DOI references
Found 5 DOI reference(s) in README -
○Academic publication links
-
✓Committers with academic emails
2 of 5 committers (40.0%) from academic institutions -
○Institutional organization owner
-
○JOSS paper metadata
-
○Scientific vocabulary similarity
Low similarity (15.3%) to scientific vocabulary
Keywords
Repository
Dynamical graphical models for multivariate time series data to estimate directed dynamic relationships in networks.
Statistics
- Stars: 25
- Watchers: 7
- Forks: 14
- Open Issues: 6
- Releases: 0
Topics
Metadata Files
README.md
DGM: Dynamical graphical models for multivariate time series data to estimate directed dynamic networks in functional MRI

The aim of this package is to study directed dynamic functional connectivity in functional MRI. Dynamic graphical models (DGM) belong to the family of Dynamic Bayesian Networks. DGM is a collection of Dynamic Linear Models (DLM) [1], a dynamic multiple regression at each node. Moreover, DGM searches through all possible parent models and provides an interpretable fit in terms of regression model for each network node. There is a special variant of DGM called Multiregression Dynamic Models (MDM) which constrain the network to a acyclic graph [2,3], but with DGM, we do not use this constrain.
Current research aims to fully characterize DGM using simulations and big data from the Human Connectome Project (HCP) in order to test validity and reliability to make this new method available for neuroimaging research.
Reference
Schwab, S., Harbord, R., Zerbi, V., Elliott, L., Afyouni, S., Smith, J. Q., … Nichols, T. E. (2018). Directed functional connectivity using dynamic graphical models. NeuroImage. doi:10.1016/j.neuroimage.2018.03.074.
Additional References
- West, M., & Harrison, J. (1997). Bayesian Forecasting and Dynamic Models. Springer New York.
- Costa, L., Smith, J., Nichols, T., Cussens, J., Duff, E. P., & Makin, T. R. (2015). Searching Multiregression Dynamic Models of Resting-State fMRI Networks Using Integer Programming. Bayesian Analysis , 10(2), 441–478. https://doi.org/10.1214/14-BA913.
- Queen, C. M., & Smith, J. Q. (1993). Multiregression Dynamic Models. Journal of the Royal Statistical Society. Series B, Statistical Methodology, 55(4), 849–870. Retrieved from http://www.jstor.org/stable/2345998.
User Guide
Installation
The installation is 2MB, with dependencies approx. 86MB.
From CRAN:
install.packages("DGM")
Before installing DGM and all it dependencies sometimes you have to upgrade the C++ compiler on the cluster scl enable devtoolset-4 bash
Latest develop version
install.packages("devtools")
library(devtools)
install_github("schw4b/DGM", ref = "develop")
Running a DGM example with simulated data
We load simulation data of a 5-node network with 200 samples (time points) of one subject. Time series should already be mean centered.
library(DGM)
data("utestdata")
dim(myts)
[1] 200   5
Now, let's do a full search across all possible parent models of the size n2(n-1). Here, with n=5, we have 16 possible models for each node, for example for node 3.
result=exhaustive.search(myts,3)
result$model.store
          [,1]      [,2]      [,3]      [,4]      [,5]      [,6]     [,7]      [,8]      [,9]     [,10]     [,11]     [,12]     [,13]     [,14]     [,15]     [,16]
[1,]    1.0000    2.0000    3.0000    4.0000    5.0000    6.0000    7.000    8.0000    9.0000   10.0000   11.0000   12.0000   13.0000   14.0000   15.0000   16.0000
[2,]    0.0000    1.0000    2.0000    4.0000    5.0000    1.0000    1.000    1.0000    2.0000    2.0000    4.0000    1.0000    1.0000    1.0000    2.0000    1.0000
[3,]    0.0000    0.0000    0.0000    0.0000    0.0000    2.0000    4.000    5.0000    4.0000    5.0000    5.0000    2.0000    2.0000    4.0000    4.0000    2.0000
[4,]    0.0000    0.0000    0.0000    0.0000    0.0000    0.0000    0.000    0.0000    0.0000    0.0000    0.0000    4.0000    5.0000    5.0000    5.0000    4.0000
[5,]    0.0000    0.0000    0.0000    0.0000    0.0000    0.0000    0.000    0.0000    0.0000    0.0000    0.0000    0.0000    0.0000    0.0000    0.0000    5.0000
[6,] -353.6734 -348.1476 -329.9119 -359.3472 -346.9735 -348.4044 -355.495 -347.4541 -337.3578 -333.6073 -353.8772 -349.6878 -346.9843 -358.2056 -341.7462 -355.5821
[7,]    0.5000    0.7300    0.6800    0.7700    0.7600    0.7800    0.800    0.7900    0.7300    0.7700    0.8100    0.7900    0.8300    0.8400    0.7800    0.8300
The columns are the 16 different models. First row indicates model number, rows 2-5 the parents, row 6 the model evidence, a log likelihood, and row 7 the discount factor delta, reflecting the smoothness of the time-varying regression coefficient (theta). To get the winning model, we simply maximize across model evidence.
which.max(result$model.store[6,])
[1] 3
Model number 3 with node 2 as a parent is most likely.
Analysis on the subject-level
We do a full search on the subject level (exhautive search on each node). The list returned contains all the models (models), the winning models (winner), the adjacency matrix of the network (adj).
s=subject(myts)
names(s)
[1] "models" "winner" "adj"
The adj structure contains the adjacency matrix of the network (am), the model evidence (lpl), and the discount factors delta (df).
names(s$adj)
[1] "am"  "lpl" "df"
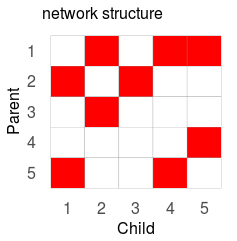
Plot network as adjacency matrix
The full network structure can be plotted as follows:
gplotMat(s$adj$am, hasColMap = F, title = "network")
Computation time
Estimates for a time-series with 1200 samples with a 2.6GHz CPU.
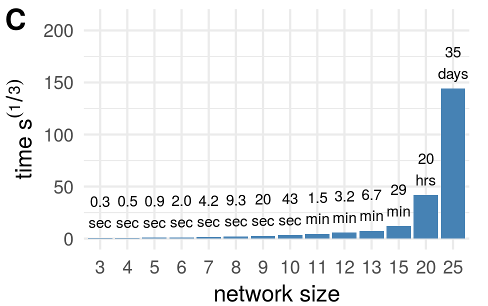
Timings are for one node only. To estimate the full network (all parents of all the nodes, the numbers above have to be multiplied by the number of nodes.
The greedy search, a network discovery optimization, is now available since DGM version 1.7 that can estimate 100-200 nodes within less than a day.
Owner
- Name: Simon Schwab
- Login: schw4b
- Kind: user
- Location: Switzerland
- Company: Swisstransplant
- Website: https://schw4b.github.io/
- Twitter: SimonSchw4b
- Repositories: 4
- Profile: https://github.com/schw4b
I'm a senior researcher and transplant statistician at Swisstransplant.
GitHub Events
Total
- Fork event: 1
Last Year
- Fork event: 1
Committers
Last synced: over 2 years ago
Top Committers
| Name | Commits | |
|---|---|---|
| Simon Schwab | s****b@g****m | 180 |
| RuthHarbord | r****d@w****k | 13 |
| Ruth Harbord | R****h@1****k | 2 |
| Ruth | R****h@C****l | 2 |
| Dirk Eddelbuettel | e****d@d****g | 1 |
Committer Domains (Top 20 + Academic)
Issues and Pull Requests
Last synced: 10 months ago
All Time
- Total issues: 10
- Total pull requests: 4
- Average time to close issues: 3 months
- Average time to close pull requests: about 2 months
- Total issue authors: 2
- Total pull request authors: 3
- Average comments per issue: 0.7
- Average comments per pull request: 0.5
- Merged pull requests: 3
- Bot issues: 0
- Bot pull requests: 0
Past Year
- Issues: 0
- Pull requests: 0
- Average time to close issues: N/A
- Average time to close pull requests: N/A
- Issue authors: 0
- Pull request authors: 0
- Average comments per issue: 0
- Average comments per pull request: 0
- Merged pull requests: 0
- Bot issues: 0
- Bot pull requests: 0
Top Authors
Issue Authors
- schw4b (8)
- RuthHarbord (2)
Pull Request Authors
- RuthHarbord (2)
- eddelbuettel (1)
- schw4b (1)
Top Labels
Issue Labels
Pull Request Labels
Packages
- Total packages: 1
-
Total downloads:
- cran 295 last-month
- Total dependent packages: 0
- Total dependent repositories: 0
- Total versions: 3
- Total maintainers: 1
cran.r-project.org: DGM
Dynamic Graphical Models
- Homepage: https://github.com/schw4b/DGM
- Documentation: http://cran.r-project.org/web/packages/DGM/DGM.pdf
- License: GPL-3
-
Latest release: 1.7.4
published over 4 years ago
Rankings
Maintainers (1)
Dependencies
- R >= 3.2.0 depends
- Rcpp >= 0.11.0 imports
- coin >= 1.2 imports
- data.table >= 1.10.0 imports
- ggplot2 >= 2.2.1 imports
- reshape2 >= 1.4.2 imports
- testthat * suggests