easyalluvial
create alluvial plots with a single line of code
Science Score: 23.0%
This score indicates how likely this project is to be science-related based on various indicators:
-
○CITATION.cff file
-
○codemeta.json file
-
○.zenodo.json file
-
✓DOI references
Found 1 DOI reference(s) in README -
✓Academic publication links
Links to: plos.org -
○Committers with academic emails
-
○Institutional organization owner
-
○JOSS paper metadata
-
○Scientific vocabulary similarity
Low similarity (19.1%) to scientific vocabulary
Last synced: 11 months ago
·
JSON representation
Repository
create alluvial plots with a single line of code
Basic Info
- Host: GitHub
- Owner: erblast
- Language: R
- Default Branch: master
- Homepage: https://erblast.github.io/easyalluvial/
- Size: 1020 MB
Statistics
- Stars: 113
- Watchers: 5
- Forks: 11
- Open Issues: 10
- Releases: 10
Created almost 8 years ago
· Last pushed 11 months ago
Metadata Files
Readme
README.Rmd
---
output: github_document
editor_options:
chunk_output_type: console
---
```{r, echo = FALSE}
knitr::opts_chunk$set(
collapse = TRUE,
comment = "#>",
warning = FALSE,
fig.path = "man/figures/README-"
)
```
# easyalluvial  [](https://github.com/erblast/easyalluvial/actions)
[](https://codecov.io/github/erblast/easyalluvial?branch=master)
[](https://CRAN.R-project.org/package=easyalluvial)
[](https://CRAN.R-project.org/package=easyalluvial)
[](https://CRAN.R-project.org/package=easyalluvial)
Alluvial plots are similar to [sankey diagrams](https://en.wikipedia.org/wiki/Sankey_diagram) and visualise categorical data over multiple dimensions as flows. [Rosval et. al. 2010](https://journals.plos.org/plosone/article?id=10.1371/journal.pone.0008694) Their graphical grammar however is a bit more complex then that of a regular x/y plots. The [`ggalluvial`](http://corybrunson.github.io/ggalluvial/) package made a great job of translating that grammar into [`ggplot2`](https://github.com/tidyverse/ggplot2) syntax and gives you many option to tweak the appearance of an alluvial plot, however there still remains a multi-layered complexity that makes it difficult to use 'ggalluvial' for explorative data analysis. 'easyalluvial' provides a simple interface to this package that allows you to produce a decent alluvial plot from any dataframe in either long or wide format from a single line of code while also handling continuous data. It is meant to allow a quick visualisation of entire dataframes with a focus on different colouring options that can make alluvial plots a great tool for data exploration.
## Features
- plot alluvial graph with a single line of code of a given dataframe
- support for wide and long data format [(wiki, wide vs. long/narrow data)](https://en.wikipedia.org/wiki/Wide_and_narrow_data)
- automatically transforms numerical to categorical data
- helper functions for variable selection
- convenient parameters for coloring and ordering
- marginal histograms
- **model agnostic partial dependence and model response alluvial plots with 4 dimensions**
- **[interactive plots with `easyalluvial` and `parcats`](https://erblast.github.io/parcats/articles/parcats.html)**
## Installation
### CRAN
```{r cran, eval = FALSE }
install.packages('easyalluvial')
```
### Development Version
```{r gh-installation, eval = FALSE}
# install.packages("devtools")
devtools::install_github("erblast/easyalluvial")
```
## Documentation
- [pkgdown website](https://erblast.github.io/easyalluvial/)
* [Data Exploration with Alluvial Plots](https://erblast.github.io/easyalluvial/articles/data_exploration.html)
* [Visualising Model Response ](https://erblast.github.io/easyalluvial/articles/model_response.html)
* [Interactive Plots with parcats](https://erblast.github.io/easyalluvial/articles/parcats.html)
## Examples
```{r}
suppressPackageStartupMessages( require(tidyverse) )
suppressPackageStartupMessages( require(easyalluvial) )
```
### Alluvial from data in wide format
#### Sample Data
```{r wide}
knitr::kable( head(mtcars2) )
```
#### Plot
Continuous Variables will be automatically binned as follows.
- High, High (HH)
- Medium, High (MH)
- Medium (M)
- Medium, Low (ML)
- Low, Low (LL)
```{r wide_plot }
alluvial_wide( data = mtcars2
, max_variables = 5
, fill_by = 'first_variable' )
```
### Alluvial from data in long format
#### Sample Data
```{r long}
knitr::kable( head(quarterly_flights) )
```
#### Plot
```{r plot_long}
alluvial_long( quarterly_flights
, key = qu
, value = mean_arr_delay
, id = tailnum
, fill = carrier )
```
### Marginal Histograms
```{r}
alluvial_wide( data = mtcars2
, max_variables = 5
, fill_by = 'first_variable' ) %>%
add_marginal_histograms(mtcars2)
```
### Interactive Graphs
```{r eval = F}
suppressPackageStartupMessages( require(parcats) )
p = alluvial_wide(mtcars2, max_variables = 5)
parcats(p, marginal_histograms = TRUE, data_input = mtcars2)
```
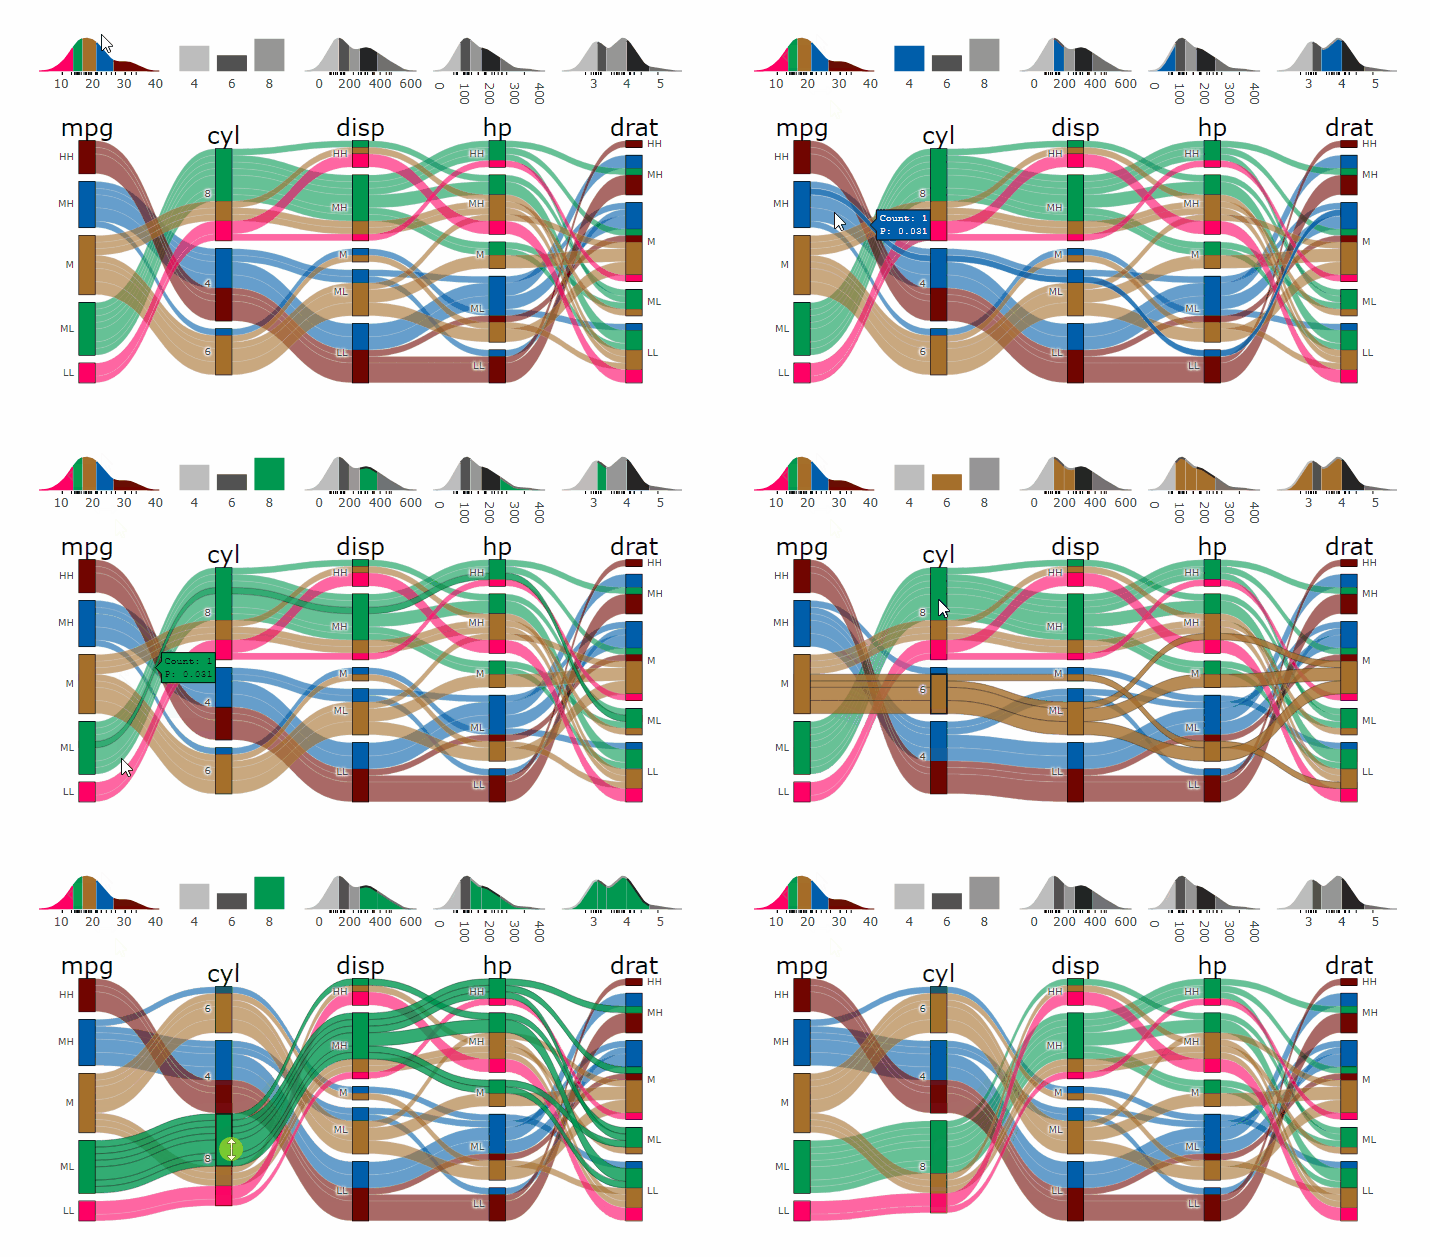
- **[Live Widget](https://erblast.github.io/parcats/articles/parcats.html)**
### Partial Dependence Alluvial Plots
Alluvial plots are capable of displaying higher dimensional data on a plane, thus lend themselves to plot the response of a statistical model to changes in the input data across multiple dimensions. The practical limit here is 4 dimensions while conventional partial dependence plots are limited to 2 dimensions.
Briefly the 4 variables with the highest feature importance for a given model are selected and 5 values spread over the variable range are selected for each. Then a grid of all possible combinations is created. All none-plotted variables are set to the values found in the first row of the training data set. Using this artificial data space model predictions are being generated. This process is then repeated for each row in the training data set and the overall model response is averaged in the end. Each of the possible combinations is plotted as a flow which is coloured by the bin corresponding to the average model response generated by that particular combination.
- [more on partial dependence plots (ebook)](https://christophm.github.io/interpretable-ml-book/)
- [Tutorial](https://www.datisticsblog.com/2019/04/visualising-model-response-with-easyalluvial/)
`easyalluvial` contains wrappers for `parsnip` and `caret` models. Custom Wrappers for other models can easily be created.
```{r fig.width=12, fig.height= 9}
df = select(mtcars2, -ids)
m = parsnip::rand_forest(mode = "regression") %>%
parsnip::set_engine("randomForest") %>%
parsnip::fit(disp ~ ., df)
p = alluvial_model_response_parsnip(m, df, degree = 4, method = "pdp")
p_grid = add_marginal_histograms(p, df, plot = F) %>%
add_imp_plot(p, df)
```
### Interactive Partial Dependence Plot
```{r eval = F}
parcats(p, marginal_histograms = TRUE, imp = TRUE, data_input = df)
```
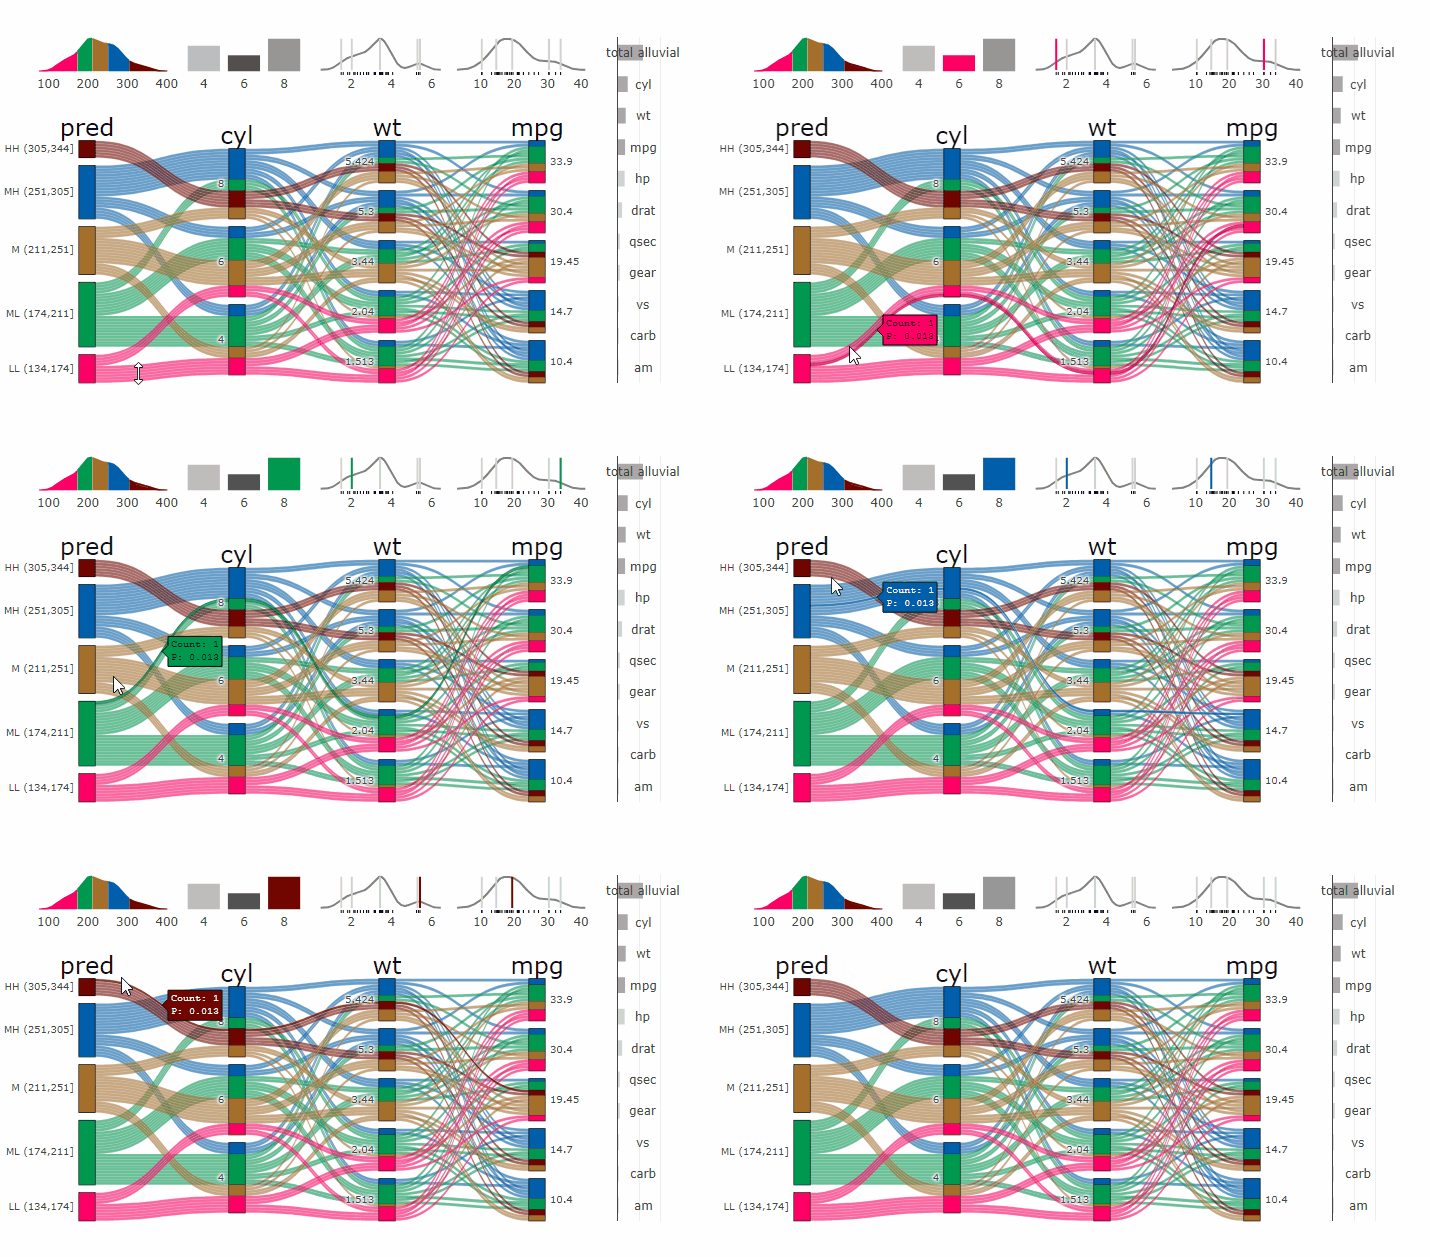
- **[Live Widget](https://erblast.github.io/parcats/articles/parcats.html)**
# ClinicoPath {jamovi} Module
[ClinicoPath jamovi Module](https://github.com/sbalci/ClinicoPathJamoviModule) (thanks to Serdar Balci) adds `easyalluvial` plots to `jamovi`a spreadsheet interface for doing statistics with `R`.
# Similar Packages
- [`ggalluvial`](https://github.com/corybrunson/ggalluvial/)
- [`alluvial`](https://github.com/mbojan/alluvial)
- [`networkD3`](https://github.com/christophergandrud/networkD3)
- [`ggbump`](https://github.com/davidsjoberg/ggbump)
[](https://github.com/erblast/easyalluvial/actions)
[](https://codecov.io/github/erblast/easyalluvial?branch=master)
[](https://CRAN.R-project.org/package=easyalluvial)
[](https://CRAN.R-project.org/package=easyalluvial)
[](https://CRAN.R-project.org/package=easyalluvial)
Alluvial plots are similar to [sankey diagrams](https://en.wikipedia.org/wiki/Sankey_diagram) and visualise categorical data over multiple dimensions as flows. [Rosval et. al. 2010](https://journals.plos.org/plosone/article?id=10.1371/journal.pone.0008694) Their graphical grammar however is a bit more complex then that of a regular x/y plots. The [`ggalluvial`](http://corybrunson.github.io/ggalluvial/) package made a great job of translating that grammar into [`ggplot2`](https://github.com/tidyverse/ggplot2) syntax and gives you many option to tweak the appearance of an alluvial plot, however there still remains a multi-layered complexity that makes it difficult to use 'ggalluvial' for explorative data analysis. 'easyalluvial' provides a simple interface to this package that allows you to produce a decent alluvial plot from any dataframe in either long or wide format from a single line of code while also handling continuous data. It is meant to allow a quick visualisation of entire dataframes with a focus on different colouring options that can make alluvial plots a great tool for data exploration.
## Features
- plot alluvial graph with a single line of code of a given dataframe
- support for wide and long data format [(wiki, wide vs. long/narrow data)](https://en.wikipedia.org/wiki/Wide_and_narrow_data)
- automatically transforms numerical to categorical data
- helper functions for variable selection
- convenient parameters for coloring and ordering
- marginal histograms
- **model agnostic partial dependence and model response alluvial plots with 4 dimensions**
- **[interactive plots with `easyalluvial` and `parcats`](https://erblast.github.io/parcats/articles/parcats.html)**
## Installation
### CRAN
```{r cran, eval = FALSE }
install.packages('easyalluvial')
```
### Development Version
```{r gh-installation, eval = FALSE}
# install.packages("devtools")
devtools::install_github("erblast/easyalluvial")
```
## Documentation
- [pkgdown website](https://erblast.github.io/easyalluvial/)
* [Data Exploration with Alluvial Plots](https://erblast.github.io/easyalluvial/articles/data_exploration.html)
* [Visualising Model Response ](https://erblast.github.io/easyalluvial/articles/model_response.html)
* [Interactive Plots with parcats](https://erblast.github.io/easyalluvial/articles/parcats.html)
## Examples
```{r}
suppressPackageStartupMessages( require(tidyverse) )
suppressPackageStartupMessages( require(easyalluvial) )
```
### Alluvial from data in wide format
#### Sample Data
```{r wide}
knitr::kable( head(mtcars2) )
```
#### Plot
Continuous Variables will be automatically binned as follows.
- High, High (HH)
- Medium, High (MH)
- Medium (M)
- Medium, Low (ML)
- Low, Low (LL)
```{r wide_plot }
alluvial_wide( data = mtcars2
, max_variables = 5
, fill_by = 'first_variable' )
```
### Alluvial from data in long format
#### Sample Data
```{r long}
knitr::kable( head(quarterly_flights) )
```
#### Plot
```{r plot_long}
alluvial_long( quarterly_flights
, key = qu
, value = mean_arr_delay
, id = tailnum
, fill = carrier )
```
### Marginal Histograms
```{r}
alluvial_wide( data = mtcars2
, max_variables = 5
, fill_by = 'first_variable' ) %>%
add_marginal_histograms(mtcars2)
```
### Interactive Graphs
```{r eval = F}
suppressPackageStartupMessages( require(parcats) )
p = alluvial_wide(mtcars2, max_variables = 5)
parcats(p, marginal_histograms = TRUE, data_input = mtcars2)
```

- **[Live Widget](https://erblast.github.io/parcats/articles/parcats.html)**
### Partial Dependence Alluvial Plots
Alluvial plots are capable of displaying higher dimensional data on a plane, thus lend themselves to plot the response of a statistical model to changes in the input data across multiple dimensions. The practical limit here is 4 dimensions while conventional partial dependence plots are limited to 2 dimensions.
Briefly the 4 variables with the highest feature importance for a given model are selected and 5 values spread over the variable range are selected for each. Then a grid of all possible combinations is created. All none-plotted variables are set to the values found in the first row of the training data set. Using this artificial data space model predictions are being generated. This process is then repeated for each row in the training data set and the overall model response is averaged in the end. Each of the possible combinations is plotted as a flow which is coloured by the bin corresponding to the average model response generated by that particular combination.
- [more on partial dependence plots (ebook)](https://christophm.github.io/interpretable-ml-book/)
- [Tutorial](https://www.datisticsblog.com/2019/04/visualising-model-response-with-easyalluvial/)
`easyalluvial` contains wrappers for `parsnip` and `caret` models. Custom Wrappers for other models can easily be created.
```{r fig.width=12, fig.height= 9}
df = select(mtcars2, -ids)
m = parsnip::rand_forest(mode = "regression") %>%
parsnip::set_engine("randomForest") %>%
parsnip::fit(disp ~ ., df)
p = alluvial_model_response_parsnip(m, df, degree = 4, method = "pdp")
p_grid = add_marginal_histograms(p, df, plot = F) %>%
add_imp_plot(p, df)
```
### Interactive Partial Dependence Plot
```{r eval = F}
parcats(p, marginal_histograms = TRUE, imp = TRUE, data_input = df)
```

- **[Live Widget](https://erblast.github.io/parcats/articles/parcats.html)**
# ClinicoPath {jamovi} Module
[ClinicoPath jamovi Module](https://github.com/sbalci/ClinicoPathJamoviModule) (thanks to Serdar Balci) adds `easyalluvial` plots to `jamovi`a spreadsheet interface for doing statistics with `R`.
# Similar Packages
- [`ggalluvial`](https://github.com/corybrunson/ggalluvial/)
- [`alluvial`](https://github.com/mbojan/alluvial)
- [`networkD3`](https://github.com/christophergandrud/networkD3)
- [`ggbump`](https://github.com/davidsjoberg/ggbump)
Owner
- Name: Björn Oettinghaus
- Login: erblast
- Kind: user
- Location: Switzerland
- Website: www.datisticsblog.com
- Repositories: 3
- Profile: https://github.com/erblast
GitHub Events
Total
- Issues event: 3
- Watch event: 5
- Issue comment event: 3
- Push event: 9
- Pull request event: 7
- Fork event: 1
- Create event: 1
Last Year
- Issues event: 3
- Watch event: 5
- Issue comment event: 3
- Push event: 9
- Pull request event: 7
- Fork event: 1
- Create event: 1
Committers
Last synced: over 2 years ago
Top Committers
| Name | Commits | |
|---|---|---|
| erblast | e****1@g****e | 187 |
| koneswab | b****a@r****m | 25 |
Issues and Pull Requests
Last synced: 11 months ago
All Time
- Total issues: 27
- Total pull requests: 16
- Average time to close issues: 5 months
- Average time to close pull requests: 12 days
- Total issue authors: 13
- Total pull request authors: 4
- Average comments per issue: 1.78
- Average comments per pull request: 0.63
- Merged pull requests: 12
- Bot issues: 0
- Bot pull requests: 0
Past Year
- Issues: 2
- Pull requests: 5
- Average time to close issues: N/A
- Average time to close pull requests: 19 days
- Issue authors: 2
- Pull request authors: 2
- Average comments per issue: 0.0
- Average comments per pull request: 0.4
- Merged pull requests: 3
- Bot issues: 0
- Bot pull requests: 0
Top Authors
Issue Authors
- erblast (14)
- talegari (2)
- greenwood-stat (1)
- corybrunson (1)
- paleolimbot (1)
- factorialmap (1)
- sbalci (1)
- eprieto012 (1)
- akarlinsky (1)
- topepo (1)
- Jgruetzke (1)
- hcp4715 (1)
- edvardoss (1)
Pull Request Authors
- erblast (12)
- teunbrand (2)
- gernophil (1)
- olivroy (1)
Top Labels
Issue Labels
enhancement (3)
bug (1)
Pull Request Labels
Packages
- Total packages: 1
-
Total downloads:
- cran 413 last-month
- Total dependent packages: 1
- Total dependent repositories: 3
- Total versions: 10
- Total maintainers: 1
cran.r-project.org: easyalluvial
Generate Alluvial Plots with a Single Line of Code
- Homepage: https://github.com/erblast/easyalluvial/
- Documentation: http://cran.r-project.org/web/packages/easyalluvial/easyalluvial.pdf
- License: CC0
-
Latest release: 0.4.0
published 11 months ago
Rankings
Stargazers count: 3.7%
Forks count: 7.3%
Dependent repos count: 16.4%
Dependent packages count: 18.1%
Average: 26.1%
Downloads: 85.0%
Maintainers (1)
Last synced:
11 months ago
Dependencies
DESCRIPTION
cran
- R >= 3.5 depends
- RColorBrewer * imports
- dplyr * imports
- forcats * imports
- ggalluvial >= 0.9.1 imports
- ggplot2 >= 3.2.0 imports
- ggridges * imports
- gridExtra * imports
- magrittr * imports
- progress * imports
- progressr * imports
- purrr * imports
- randomForest * imports
- recipes >= 0.1.5 imports
- rlang * imports
- stringr * imports
- tibble * imports
- tidyr >= 1.0.0 imports
- ISLR * suggests
- caret * suggests
- covr * suggests
- e1071 * suggests
- earth * suggests
- furrr * suggests
- future * suggests
- glmnet * suggests
- mlbench * suggests
- nycflights13 * suggests
- parsnip * suggests
- pkgdown * suggests
- rpart * suggests
- testthat * suggests
- vdiffr >= 0.3.1 suggests
- vip * suggests
- workflows * suggests
- xgboost * suggests
.github/workflows/R-CMD-check.yaml
actions
- actions/checkout v3 composite
- r-lib/actions/check-r-package v2 composite
- r-lib/actions/setup-r v2 composite
- r-lib/actions/setup-r-dependencies v2 composite
.github/workflows/articles.yml
actions
- actions/checkout v3 composite
- r-lib/actions/setup-r v2 composite
- r-lib/actions/setup-r-dependencies v2 composite
.github/workflows/coverage.yaml
actions
- actions/checkout v3 composite
- actions/upload-artifact v3 composite
- r-lib/actions/setup-r v2 composite
- r-lib/actions/setup-r-dependencies v2 composite
.github/workflows/parcats.yml
actions
- actions/checkout v3 composite
- r-lib/actions/setup-r v2 composite
- r-lib/actions/setup-r-dependencies v2 composite
.github/workflows/pkgdown.yaml
actions
- JamesIves/github-pages-deploy-action v4.4.1 composite
- actions/checkout v3 composite
- r-lib/actions/setup-pandoc v2 composite
- r-lib/actions/setup-r v2 composite
- r-lib/actions/setup-r-dependencies v2 composite
docker-compose.yml
docker
- easyalluvial_devel latest
- easyalluvial_latest latest