finalfit
Quickly create elegant regression results tables and plots when modelling in R
Science Score: 26.0%
This score indicates how likely this project is to be science-related based on various indicators:
-
○CITATION.cff file
-
✓codemeta.json file
Found codemeta.json file -
✓.zenodo.json file
Found .zenodo.json file -
○DOI references
-
○Academic publication links
-
○Committers with academic emails
-
○Institutional organization owner
-
○JOSS paper metadata
-
○Scientific vocabulary similarity
Low similarity (13.5%) to scientific vocabulary
Repository
Quickly create elegant regression results tables and plots when modelling in R
Basic Info
- Host: GitHub
- Owner: ewenharrison
- License: other
- Language: HTML
- Default Branch: master
- Homepage: https://finalfit.org/
- Size: 287 MB
Statistics
- Stars: 270
- Watchers: 11
- Forks: 28
- Open Issues: 7
- Releases: 0
Metadata Files
README.md


finalfit 
The finalfit package provides functions that help you quickly create elegant final results tables and plots when modelling in R. These can easily be exported as Word documents, PDFs, or html files.
Its design follows Hadley Wickham's tidy tool manifesto.
In addition, it provides functions for identifying and handling missing data, together with a number of functions to bootstrap simulate regression model results.
Installation
You can install finalfit from CRAN:
r
install.packages("finalfit")
It is recommended that this package is used together with dplyr which can be installed via:
r
install.packages("dplyr")
Documentation
The package documentation is maintained independently at finalfit.org.
Examples
See Get started and the All tables vignettes for extensive examples.
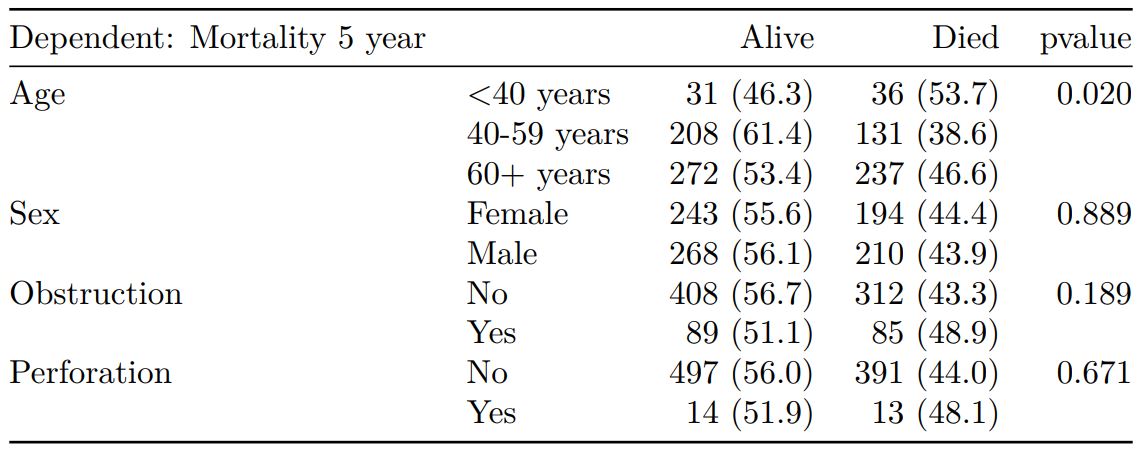
Crosstable / table 1
``` r
Crosstable
explanatory = c("age.factor", "sex.factor", "obstruct.factor") dependent = 'mort5yr' colons %>% summaryfactorlist(dependent, explanatory, p=TRUE, adddependent_label=TRUE) -> t1 knitr::kable(t1, align=c("l", "l", "r", "r", "r")) ```
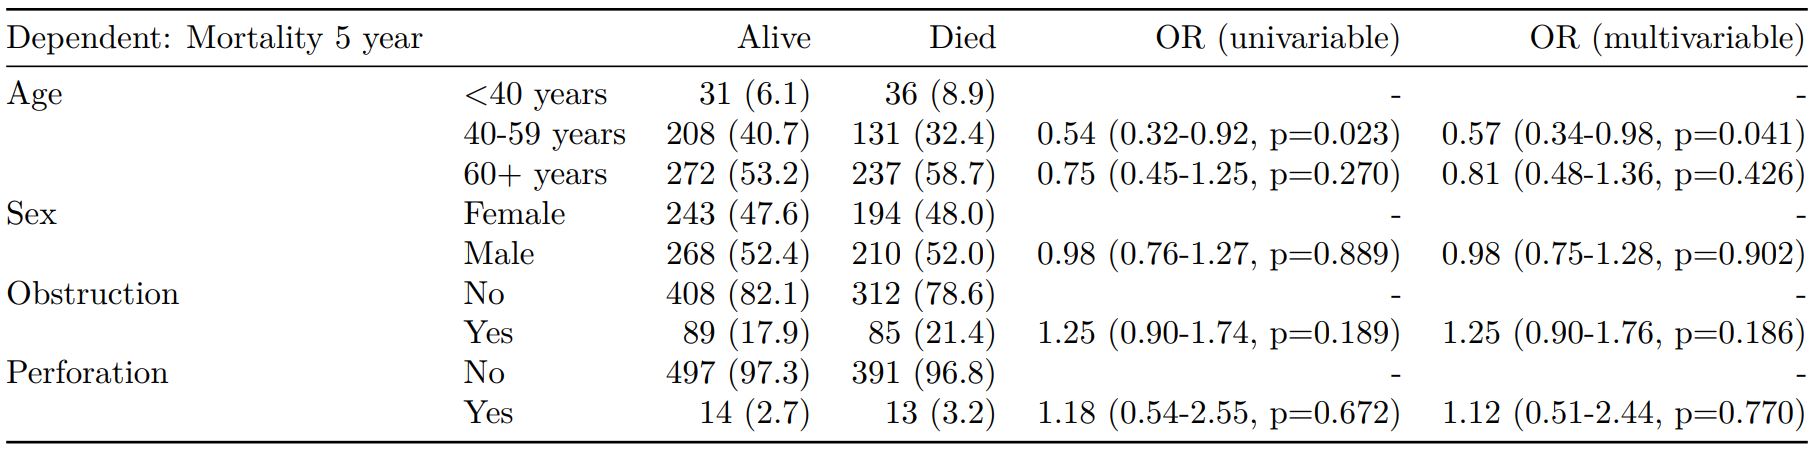
Regression table
r
explanatory = c("age.factor", "sex.factor",
  "obstruct.factor", "perfor.factor")
dependent = 'mort_5yr'
colon_s %>%
  finalfit(dependent, explanatory, metrics=TRUE) -> t2
knitr::kable(t2[[1]], row.names=FALSE, align=c("l", "l", "r", "r", "r", "r"))
knitr::kable(t2[[2]], row.names=FALSE, col.names="")
When exported to PDF:

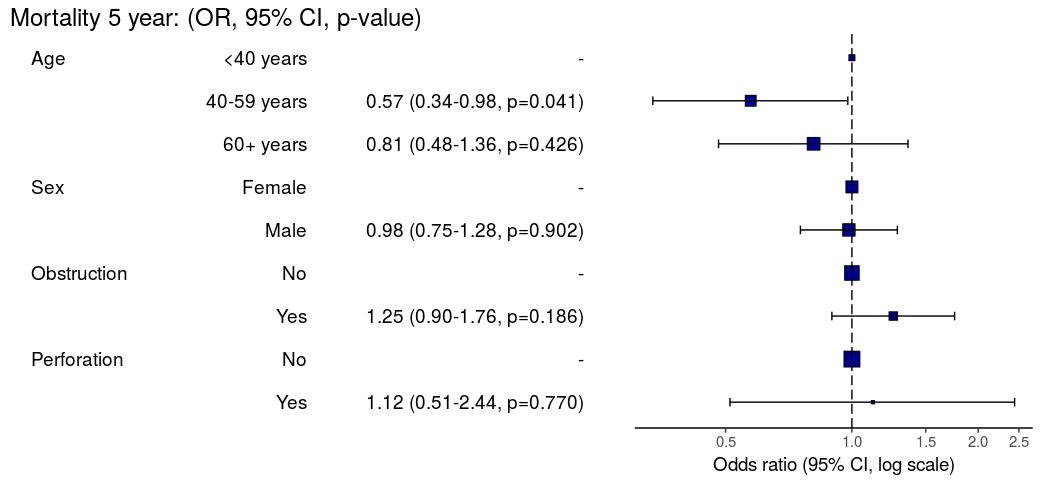
Regression plots
r
explanatory = c("age.factor", "sex.factor",
  "obstruct.factor", "perfor.factor")
dependent = 'mort_5yr'
colon_s %>%
  or_plot(dependent, explanatory)
Owner
- Login: ewenharrison
- Kind: user
- Location: Edinburgh
- Twitter: ewenharrison
- Repositories: 10
- Profile: https://github.com/ewenharrison
GitHub Events
Total
- Issues event: 2
- Watch event: 6
- Issue comment event: 1
- Push event: 2
Last Year
- Issues event: 2
- Watch event: 6
- Issue comment event: 1
- Push event: 2
Committers
Last synced: over 2 years ago
Top Committers
| Name | Commits | |
|---|---|---|
| ewenharrison | m****l@e****m | 287 |
| TAKAHASHI Kyohei | k****t@k****t | 1 |
| jric376 | j****6 | 1 |
| marius-mather | 6****r | 1 |
Committer Domains (Top 20 + Academic)
Issues and Pull Requests
Last synced: about 1 year ago
All Time
- Total issues: 98
- Total pull requests: 9
- Average time to close issues: 2 months
- Average time to close pull requests: about 2 months
- Total issue authors: 72
- Total pull request authors: 7
- Average comments per issue: 2.67
- Average comments per pull request: 0.67
- Merged pull requests: 6
- Bot issues: 0
- Bot pull requests: 0
Past Year
- Issues: 7
- Pull requests: 0
- Average time to close issues: 5 days
- Average time to close pull requests: N/A
- Issue authors: 7
- Pull request authors: 0
- Average comments per issue: 1.29
- Average comments per pull request: 0
- Merged pull requests: 0
- Bot issues: 0
- Bot pull requests: 0
Top Authors
Issue Authors
- larmarange (5)
- LukaszDerylo (4)
- graemeleehickey (4)
- shoaibraees (3)
- Temisesba (3)
- davidhen (3)
- adam-mdmph (3)
- tylcole (2)
- KMBHPB (2)
- emmanuels777 (2)
- billdenney (2)
- martinschlund (2)
- gagonzalezm (2)
- epi-stats (2)
- sbalci (2)
Pull Request Authors
- ewenharrison (3)
- jric376 (1)
- romainfrancois (1)
- Nelson-Gon (1)
- kcrt (1)
- marius-mather (1)
- onesandzeroes (1)
Top Labels
Issue Labels
Pull Request Labels
Packages
- Total packages: 1
-
Total downloads:
- cran 2,185 last-month
- Total docker downloads: 212
- Total dependent packages: 4
- Total dependent repositories: 9
- Total versions: 28
- Total maintainers: 1
cran.r-project.org: finalfit
Quickly Create Elegant Regression Results Tables and Plots when Modelling
- Homepage: https://github.com/ewenharrison/finalfit
- Documentation: http://cran.r-project.org/web/packages/finalfit/finalfit.pdf
- License: MIT + file LICENCE
-
Latest release: 1.1.0
published 11 months ago
Rankings
Maintainers (1)
Dependencies
- GGally * imports
- bdsmatrix * imports
- boot * imports
- broom * imports
- dplyr * imports
- forcats * imports
- ggplot2 * imports
- grid * imports
- gridExtra * imports
- lme4 * imports
- magrittr * imports
- mice * imports
- pROC * imports
- pillar * imports
- purrr * imports
- scales * imports
- stats * imports
- stringr * imports
- survival * imports
- tidyr >= 1.0.0 imports
- tidyselect * imports
- cmprsk * suggests
- coxme * suggests
- knitr * suggests
- lmtest * suggests
- readr * suggests
- rlang * suggests
- rmarkdown * suggests
- rstan * suggests
- sandwich * suggests
- survey * suggests
- survminer * suggests
- testthat * suggests
- tibble * suggests