TADCompare
Package for analysis and characterization of differential TADs
Science Score: 23.0%
This score indicates how likely this project is to be science-related based on various indicators:
-
○CITATION.cff file
-
○codemeta.json file
-
○.zenodo.json file
-
✓DOI references
Found 2 DOI reference(s) in README -
○Academic publication links
-
✓Committers with academic emails
1 of 3 committers (33.3%) from academic institutions -
○Institutional organization owner
-
○JOSS paper metadata
-
○Scientific vocabulary similarity
Low similarity (9.8%) to scientific vocabulary
Last synced: 10 months ago
·
JSON representation
Repository
Package for analysis and characterization of differential TADs
Basic Info
- Host: GitHub
- Owner: dozmorovlab
- License: other
- Language: R
- Default Branch: master
- Homepage: https://dozmorovlab.github.io/TADCompare/
- Size: 34.6 MB
Statistics
- Stars: 25
- Watchers: 2
- Forks: 2
- Open Issues: 3
- Releases: 0
Created almost 7 years ago
· Last pushed about 4 years ago
https://github.com/dozmorovlab/TADCompare/blob/master/
Cresswell, Kellen G., and Mikhail G. Dozmorov. [TADCompare: An R Package for Differential and Temporal Analysis of Topologically Associated Domains](https://doi.org/10.3389/fgene.2020.00158). Frontiers in Genetics 11 (March 10, 2020): 158.
`TADCompare` is an R package for differential Topologically Associated Domain (TAD) boundary detection between two Hi-C contact matrices and across a time course. It also ecables consensus TAD boundary calling across multiple Hi-C replicates. It has three main functions, `TADCompare` for differential TAD analysis, `TimeCompare` for time course analysis, and `ConsensusTADs` for consensus boundary identification. The `DiffPlot` function allows for visualizing the differences between two contact matrices.
# Installation
```
install.packages(c('dplyr', 'PRIMME', 'cluster', 'Matrix', 'magrittr', 'HiCcompare'))
if (!requireNamespace("BiocManager", quietly=TRUE))
install.packages("BiocManager")
BiocManager::install("TADCompare", version = "devel")
library(TADCompare)
```
# Input
There are three types of input accepted:
1. n x n contact matrices
2. n x (n+3) contact matrices
3. 3-column sparse contact matrices
It is required that the same format be used for each of the inputs to a given function, or an error will occur. These formats are explained in depth in the [Input Data vignette](https://bioconductor.org/packages/release/bioc/vignettes/TADCompare/inst/doc/Input_Data.html).
# Usage
Please, refer to the [TADCompare vignette](https://bioconductor.org/packages/release/bioc/vignettes/TADCompare/inst/doc/TADCompare.html) for an in depth tutorial.
## TADcompare
Differential TAD detection (`TADCompare`) involves identifying differing TAD boundaries between two contact matrices. Accordingly, the input is the two contact matrices that we would like to find these boundaries in and their corresponding resolution. The output is a dataset containing boundary scores for all regions and a dataset containing all differential and non-differential TAD boundaries.
```
# Load example contact matrices
data("GM12878.40kb.raw.chr2")
data("IMR90.40kb.raw.chr2")
# Find differential TADs
TD_Compare <- TADCompare(GM12878.40kb.raw.chr2, IMR90.40kb.raw.chr2, resolution = 40000)
```
We can then print the set of regions with at least one TAD boundary:
```
head(TD_Compare$TAD_Frame)
Boundary Gap_Score TAD_Score1 TAD_Score2 Differential Enriched_In Type
1 8200000 -2.0245884 0.02537611 1.596684 Differential Matrix 2
2 8240000 0.8091967 2.08454863 1.258245 Non-Differential Matrix 1 Non-Differential
3 8880000 2.1191814 3.44450158 1.471221 Differential Matrix 1 Split
4 8960000 -1.6590363 0.46678509 1.712167 Non-Differential Matrix 2 Non-Differential
5 9560000 -2.3232567 0.56031218 2.313139 Differential Matrix 2 Merge
6 9600000 0.2375074 1.91851750 1.552303 Non-Differential Matrix 1 Non-Differential
```
And, visualize a specific region on a chromosome:
```
# Visualizing the results
DiffPlot(tad_diff = TD_Compare,
cont_mat1 = GM12878.40kb.raw.chr2,
cont_mat2 = IMR90.40kb.raw.chr2,
resolution = 40000,
start_coord = 8000000,
end_coord = 16000000,
show_types = TRUE,
point_size = 5,
palette = "RdYlBu",
rel_heights = c(1, 2))
```
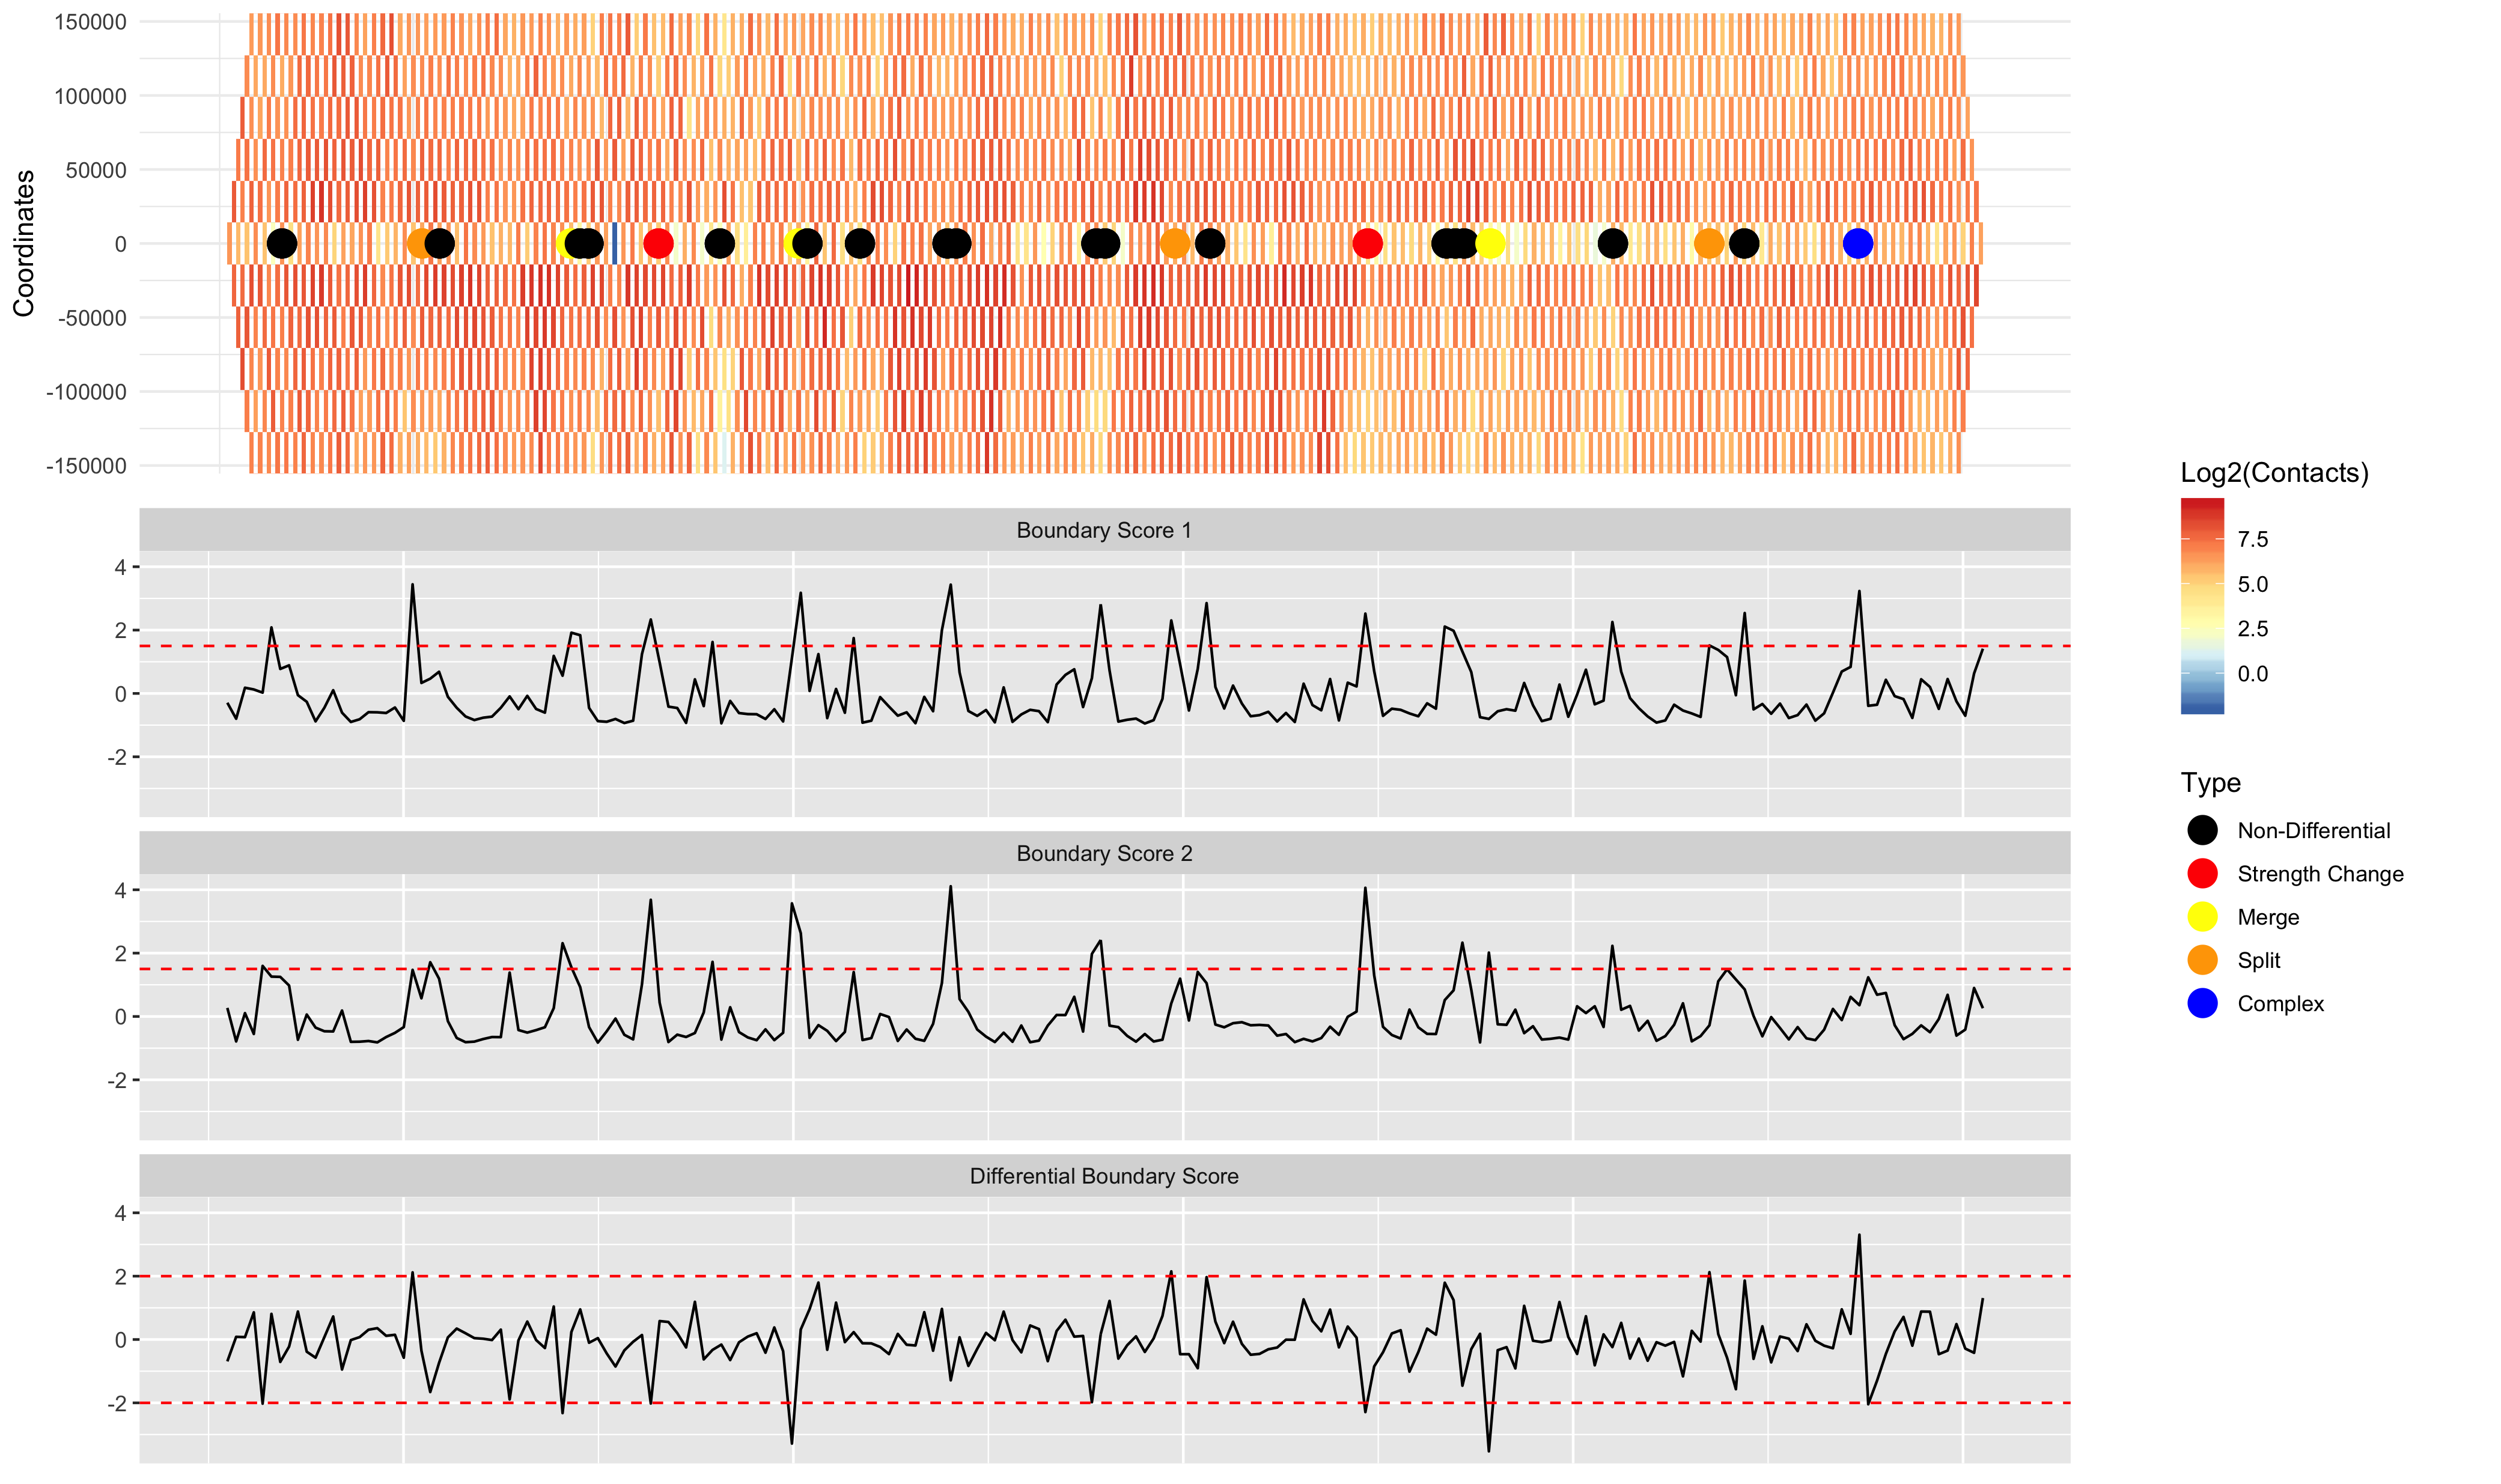
`TADCompare` detects TAD boundaries by selecting regions with TAD boundary scores above a threshold (1.5 by default). An alternative way of running `TADCompare` is to call TAD boundaries using a separate TAD caller, and then compare those pre-defined TAD boundaries. The example below uses the [SpectralTAD](https://bioconductor.org/packages/SpectralTAD/) TAD caller to pre-define TAD boundaries.
```
# Call TADs using SpectralTAD
bed_coords1 = bind_rows(SpectralTAD(GM12878.40kb.raw.chr2, chr = "chr2", levels = 3))
bed_coords2 = bind_rows(SpectralTAD(IMR90.40kb.raw.chr2, chr = "chr2", levels = 3))
# Placing the data in a list for the plotting procedure
Combined_Bed = list(bed_coords1, bed_coords2)
# Running TADCompare with pre-specified TADs
TD_Compare <- TADCompare(GM12878.40kb.raw.chr2, IMR90.40kb.raw.chr2, resolution = 40000, pre_tads = Combined_Bed)
# Visualizing the results
DiffPlot(tad_diff = TD_Compare,
cont_mat1 = GM12878.40kb.raw.chr2,
cont_mat2 = IMR90.40kb.raw.chr2,
resolution = 40000,
start_coord = 8000000,
end_coord = 16000000,
pre_tad = Combined_Bed,
show_types = FALSE,
point_size = 5,
palette = "RdYlBu",
rel_heights = c(1, 1))
```
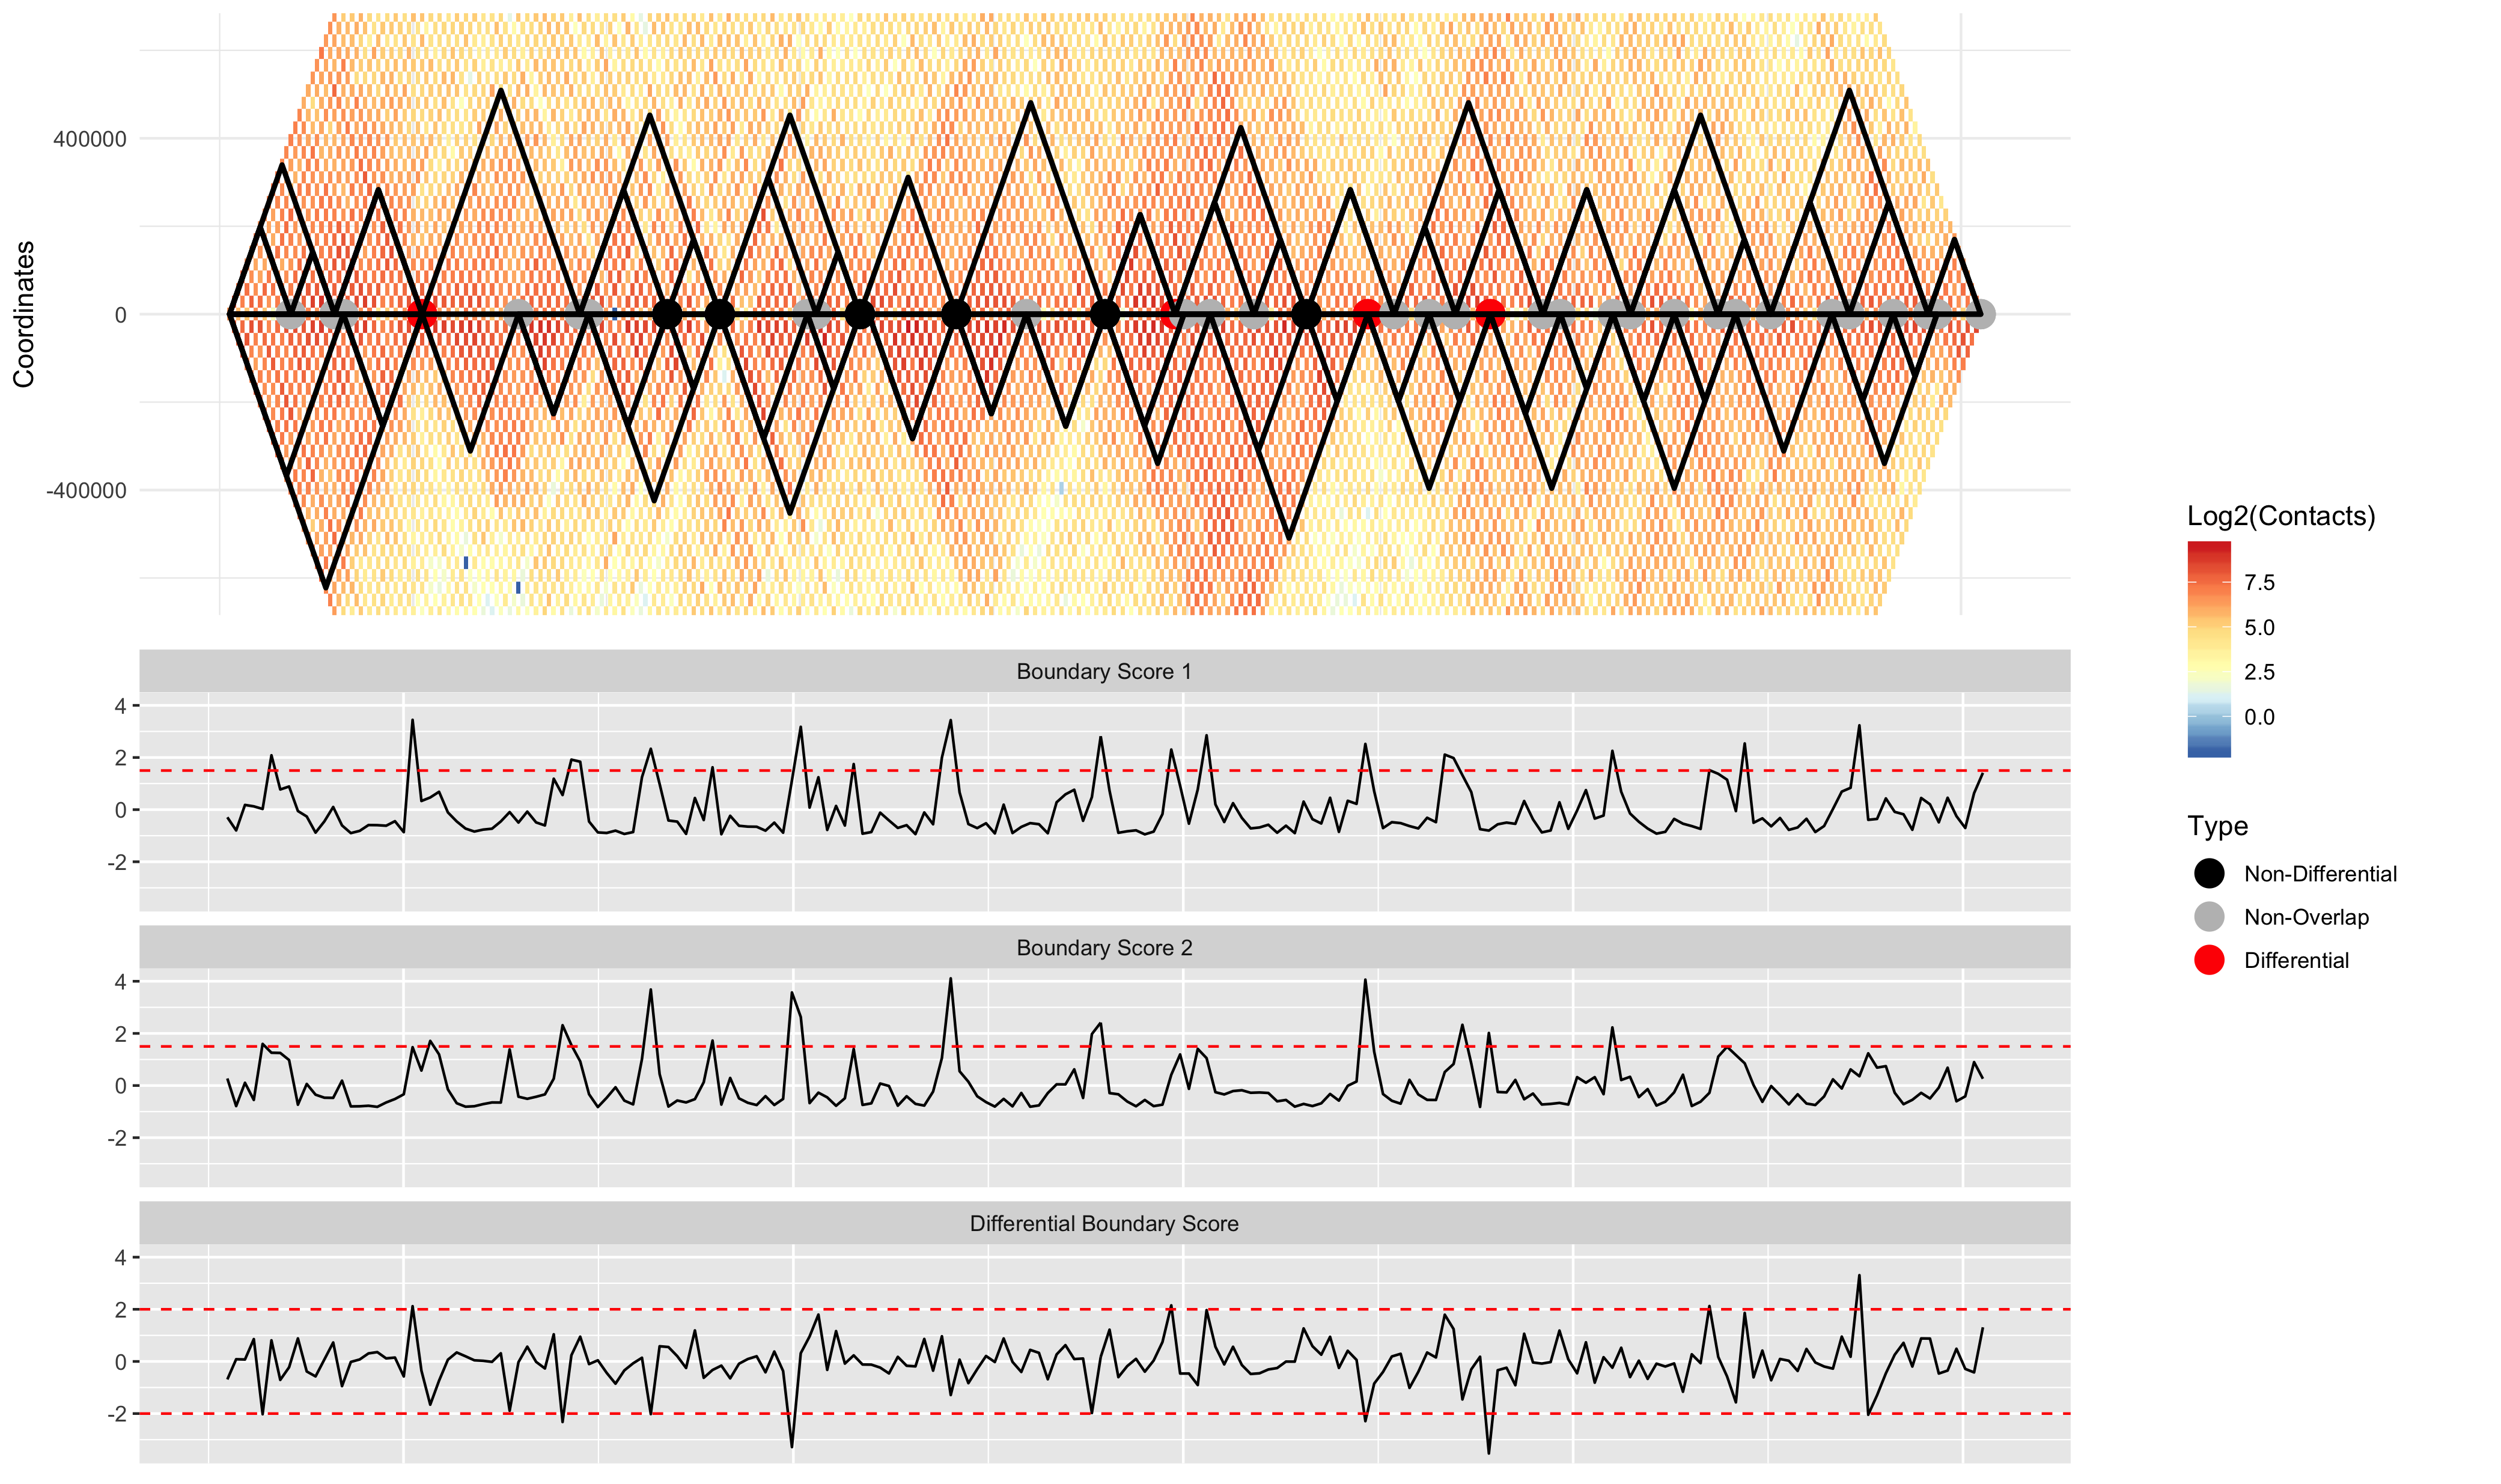
## TimeCompare
`TimeCompare` takes data from at least four time points and identifies all regions with at least one TAD. Using this information, it then classifies each region, based on how they change over time, into 6 categories (Dynamic, Highly Common, Early Appearing/Disappearing, and Late Appearing/Disappearing).
```
data("time_mats")
Time_Mats = TimeCompare(time_mats, resolution = 50000)
head(Time_Mats$TAD_Bounds)
```
The resulting output is:
```
Coordinate Sample 1 Sample 2 Sample 3 Sample 4 Consensus_Score Category
1 16900000 -0.6733709 -0.7751516 -0.7653696 15.1272253 -0.71937026 Late Appearing TAD
2 17350000 3.6406563 2.3436229 3.0253018 0.7840556 2.68446232 Early Disappearing TAD
3 18850000 0.6372268 6.3662245 -0.7876844 6.9255446 3.50172563 Early Appearing TAD
4 20700000 1.5667926 3.0968633 2.9130479 2.8300136 2.87153075 Dynamic TAD
5 22000000 -1.0079676 -0.7982571 0.6007264 3.1909178 -0.09876534 Late Appearing TAD
6 22050000 -1.0405532 -0.9892242 -0.2675822 4.2737511 -0.62840320 Late Appearing TAD
```
For each coordinate, we have the individual boundary score for each sample (Sample x), consensus boundary score (Consensus_Score), and category (Category).
## ConsensusTADs
`ConsensusTADs` uses a novel metric called the consensus boundary score to identify TAD boundaries consistently defined across multiple contact matrices. It can operate on an unlimited number of replicates, time points, or conditions.
```
data("time_mats")
con_tads = ConsensusTADs(time_mats, resolution = 50000)
head(con_tads$Consensus)
```
```
Coordinate Sample 1 Sample 2 Sample 3 Sample 4 Consensus_Score
1 18850000 0.6372268 6.366224 -0.7876844 6.925545 3.501726
2 28450000 3.1883107 3.313883 3.1711743 3.913620 3.251097
3 30000000 2.0253285 3.477652 2.9314321 3.926354 3.204542
4 32350000 2.6978488 2.455860 3.5131909 3.550942 3.105520
5 36900000 3.0731406 3.153978 3.1861296 4.489285 3.170054
```
The results are a set of coordinates with significant consensus TADs. Columns starting with "Sample" refer to the individual boundary scores. Consensus_Score is the consensus boundary score across all samples.
## Downstream analysis
The output of `TADcompare` and `TimeCompare` functions may be used for a range of analyses on genomic regions. One common one is gene ontology enrichment analysis to determine the pathways in which genes near TAD boundaries occur in. An example is shown in the [Ontology_Analysis vignette](https://bioconductor.org/packages/release/bioc/vignettes/TADCompare/inst/doc/Ontology_Analysis.html)
# Availability
The developmental version is available at https://github.com/cresswellkg/TADCompare, the stable version is available at https://github.com/dozmorovlab/TADCompare. The `master` branch contains code that can be installed into the current R version 3.6 and above. The `Bioconductor` branch contains code with the `Depends: R (>= 4.0)` requirement needed for the Bioconductor submission.
# Contributions and Support
Suggestions for new features and bug reports are welcome. Please, create a new issue for any of these or contact the author directly: @mdozmorov (mdozmorov[at]vcu[dot]edu)
# Contributors
Authors: @cresswellkg (cresswellkg[at]vcu[dot]edu) & @mdozmorov (mikhail.dozmorov[at]vcuhealth[dot]org)
Owner
- Name: Dozmorov Lab
- Login: dozmorovlab
- Kind: organization
- Website: https://dozmorovlab.github.io/
- Twitter: mikhaildozmorov
- Repositories: 5
- Profile: https://github.com/dozmorovlab
Genomics, bionformatics, computational biology, 3D genome, Hi-C
GitHub Events
Total
- Issues event: 6
- Watch event: 4
- Issue comment event: 16
Last Year
- Issues event: 6
- Watch event: 4
- Issue comment event: 16
Committers
Last synced: over 2 years ago
Top Committers
| Name | Commits | |
|---|---|---|
| cresswellkg | c****g@v****u | 193 |
| Mikhail Dozmorov | m****v@g****m | 104 |
| Nitesh Turaga | n****a@g****m | 6 |
Committer Domains (Top 20 + Academic)
vcu.edu: 1
Packages
- Total packages: 1
-
Total downloads:
- bioconductor 10,372 total
- Total dependent packages: 0
- Total dependent repositories: 0
- Total versions: 6
- Total maintainers: 1
bioconductor.org: TADCompare
TADCompare: Identification and characterization of differential TADs
- Homepage: https://github.com/dozmorovlab/TADCompare
- Documentation: https://bioconductor.org/packages/release/bioc/vignettes/TADCompare/inst/doc/TADCompare.pdf
- License: MIT + file LICENSE
-
Latest release: 1.18.0
published about 1 year ago
Rankings
Dependent repos count: 0.0%
Dependent packages count: 0.0%
Stargazers count: 7.7%
Forks count: 15.3%
Average: 19.7%
Downloads: 75.5%
Maintainers (1)
Last synced:
11 months ago
Dependencies
DESCRIPTION
cran
- R >= 4.0 depends
- HiCcompare * imports
- Matrix * imports
- PRIMME * imports
- RColorBrewer * imports
- cluster * imports
- cowplot * imports
- dplyr * imports
- ggplot2 * imports
- ggpubr * imports
- magrittr * imports
- reshape2 * imports
- tidyr * imports
- BiocStyle * suggests
- SpectralTAD * suggests
- covr * suggests
- knitr * suggests
- microbenchmark * suggests
- pheatmap * suggests
- rGREAT * suggests
- rmarkdown * suggests
- testthat * suggests