Science Score: 36.0%
This score indicates how likely this project is to be science-related based on various indicators:
-
○CITATION.cff file
-
✓codemeta.json file
Found codemeta.json file -
✓.zenodo.json file
Found .zenodo.json file -
○DOI references
-
○Academic publication links
-
✓Committers with academic emails
2 of 5 committers (40.0%) from academic institutions -
○Institutional organization owner
-
○JOSS paper metadata
-
○Scientific vocabulary similarity
Low similarity (17.7%) to scientific vocabulary
Repository
Visualization of regression functions
Basic Info
- Host: GitHub
- Owner: pbreheny
- Language: R
- Default Branch: master
- Homepage: http://pbreheny.github.io/visreg/
- Size: 13.7 MB
Statistics
- Stars: 63
- Watchers: 3
- Forks: 18
- Open Issues: 31
- Releases: 7
Metadata Files
README.md



 <!-- badges: end -->
visreg: Visualization of Regression Models
visreg is an R package for displaying the results of a fitted model in terms of how a predictor variable x affects an outcome y. The implementation of visreg takes advantage of object-oriented programming in R, meaning that it works with virtually any type of formula-based model in R provided that the model class provides a predict() method: lm, glm, gam, rlm, nlme, lmer, coxph, svm, randomForest and many more.
Installation
To install the latest release version from CRAN:
r
install.packages("visreg")
To install the latest development version from GitHub:
r
remotes::install_github("pbreheny/visreg")
Usage
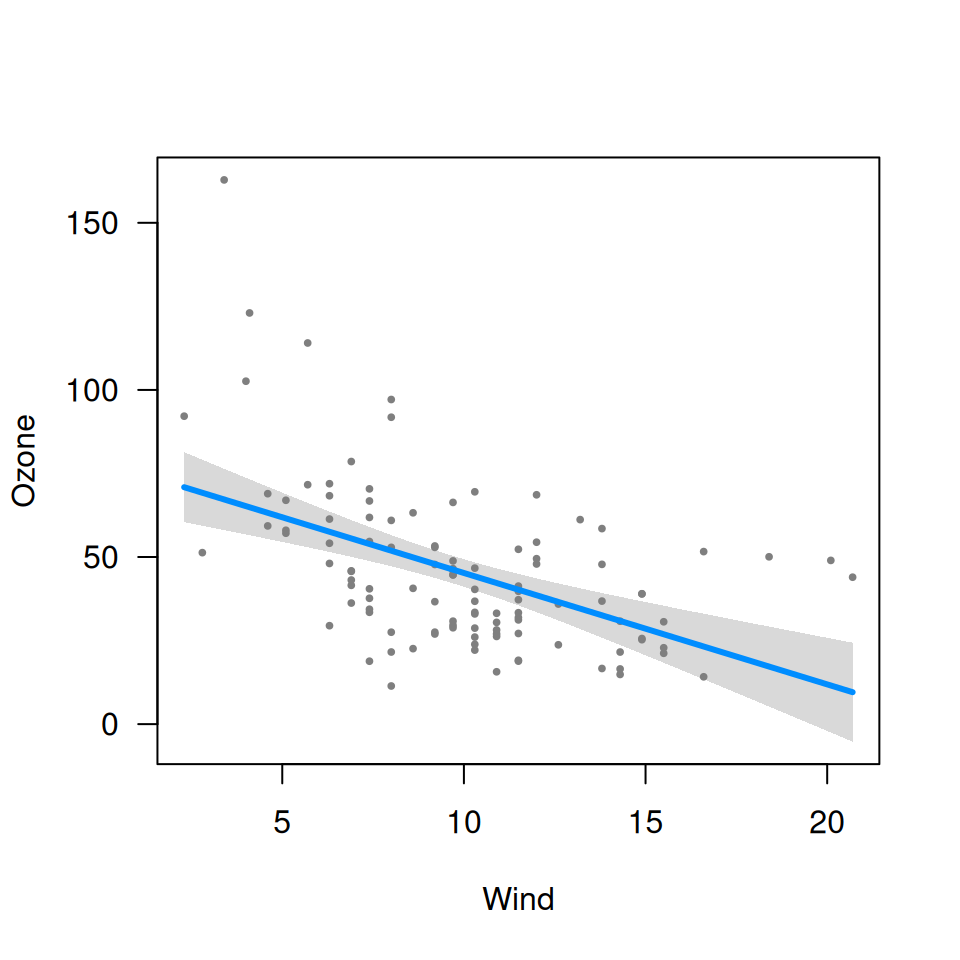
The basic usage is that you fit a model, for example:
r
fit <- lm(Ozone ~ Solar.R + Wind + Temp, data=airquality)
and then you pass it to visreg:
r
visreg(fit, "Wind")
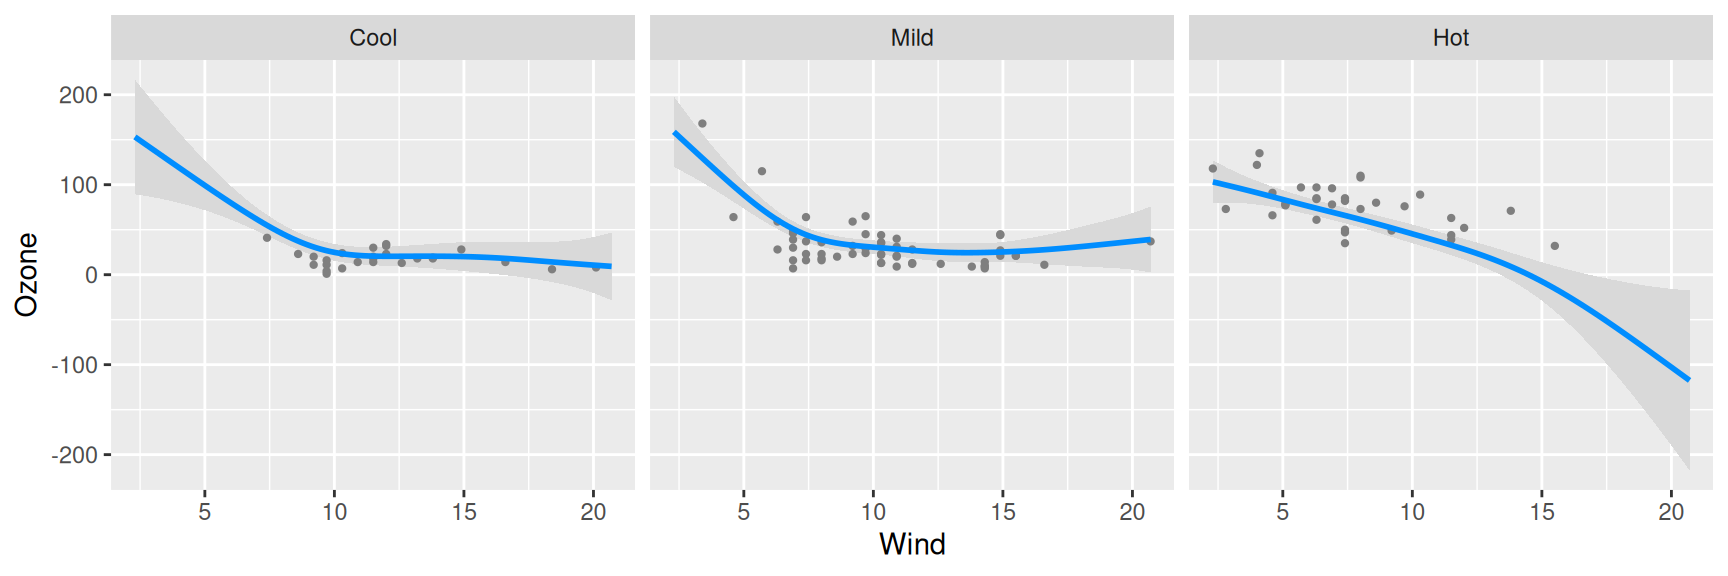
A more complex example, which uses the gam() function from mgcv:
r
airquality$Heat <- cut(airquality$Temp, 3, labels=c("Cool", "Mild", "Hot"))
fit <- gam(Ozone ~ s(Wind, by=Heat, sp=0.1), data=airquality)
visreg(fit, "Wind", "Heat", gg=TRUE, ylab="Ozone")
More information
For more information on visreg syntax and how to use it, see:
- The online documentation at https://pbreheny.github.io/visreg/ contains many examples of visreg plots and the code to create them.
- Breheny P and Burchett W (2017). Visualization of Regression Models Using visreg. The R Journal, 9: 56-71.
The website focuses more on syntax, options, and user interface, while the paper goes into more depth regarding the statistical details.
Owner
- Name: Patrick Breheny
- Login: pbreheny
- Kind: user
- Location: Iowa City, IA
- Company: University of Iowa
- Website: http://myweb.uiowa.edu/pbreheny
- Repositories: 6
- Profile: https://github.com/pbreheny
GitHub Events
Total
- Issues event: 1
- Watch event: 2
- Issue comment event: 2
- Push event: 7
Last Year
- Issues event: 1
- Watch event: 2
- Issue comment event: 2
- Push event: 7
Committers
Last synced: over 2 years ago
Top Committers
| Name | Commits | |
|---|---|---|
| Patrick Breheny | p****y@u****u | 183 |
| Patrick Breheny | p****y@u****u | 48 |
| pat5547 | p****7@g****m | 1 |
| Remko Duursma | r****a@g****m | 1 |
| jealie | j****r@g****m | 1 |
Issues and Pull Requests
Last synced: 11 months ago
All Time
- Total issues: 115
- Total pull requests: 2
- Average time to close issues: 4 months
- Average time to close pull requests: 19 days
- Total issue authors: 66
- Total pull request authors: 2
- Average comments per issue: 2.08
- Average comments per pull request: 0.5
- Merged pull requests: 2
- Bot issues: 0
- Bot pull requests: 0
Past Year
- Issues: 1
- Pull requests: 0
- Average time to close issues: N/A
- Average time to close pull requests: N/A
- Issue authors: 1
- Pull request authors: 0
- Average comments per issue: 0.0
- Average comments per pull request: 0
- Merged pull requests: 0
- Bot issues: 0
- Bot pull requests: 0
Top Authors
Issue Authors
- pbreheny (39)
- vspinu (4)
- Derek-Jones (3)
- ghost (2)
- HaoLi111 (2)
- utooley (2)
- jebyrnes (2)
- rdiaz02 (2)
- DanielReedOcean (2)
- jasonrohr (1)
- jwbenning (1)
- raymondben (1)
- kwhkim (1)
- manuSrep (1)
- GuillaumeA2 (1)
Pull Request Authors
- RemkoDuursma (1)
- jealie (1)
Top Labels
Issue Labels
Pull Request Labels
Packages
- Total packages: 1
-
Total downloads:
- cran 3,810 last-month
- Total docker downloads: 1,419
- Total dependent packages: 5
- Total dependent repositories: 14
- Total versions: 26
- Total maintainers: 1
cran.r-project.org: visreg
Visualization of Regression Models
- Homepage: https://pbreheny.github.io/visreg/
- Documentation: http://cran.r-project.org/web/packages/visreg/visreg.pdf
- License: GPL-3
-
Latest release: 2.8.0
published 11 months ago
Rankings
Maintainers (1)
Dependencies
- nlme * enhances
- lattice * imports
- MASS * suggests
- Matrix * suggests
- ggplot2 * suggests
- knitr * suggests
- rgl * suggests
- rmarkdown * suggests
- survival * suggests
- tinytest * suggests
- actions/checkout v2 composite
- r-lib/actions/check-r-package v2 composite
- r-lib/actions/setup-pandoc v2 composite
- r-lib/actions/setup-r v2 composite
- r-lib/actions/setup-r-dependencies v2 composite
- actions/checkout v2 composite
- r-lib/actions/setup-r v2 composite
- r-lib/actions/setup-r-dependencies v2 composite