tidyquant
Bringing financial analysis to the tidyverse
Science Score: 36.0%
This score indicates how likely this project is to be science-related based on various indicators:
-
○CITATION.cff file
-
✓codemeta.json file
Found codemeta.json file -
✓.zenodo.json file
Found .zenodo.json file -
○DOI references
-
○Academic publication links
-
✓Committers with academic emails
2 of 11 committers (18.2%) from academic institutions -
○Institutional organization owner
-
○JOSS paper metadata
-
○Scientific vocabulary similarity
Low similarity (17.7%) to scientific vocabulary
Keywords
dplyr
financial-analysis
financial-data
financial-statements
multiple-stocks
performance-analysis
performanceanalytics
quantmod
r-package
stock
stock-exchanges
stock-indexes
stock-lists
stock-performance
stock-prices
stock-symbol
tidyverse
time-series
timeseries
xts
Keywords from Contributors
tidy-data
summary-statistics
dbi
network-graph
easy-to-use
latex
summary-tables
rcpp
gdal
geos
Last synced: 10 months ago
·
JSON representation
Repository
Bringing financial analysis to the tidyverse
Basic Info
- Host: GitHub
- Owner: business-science
- License: other
- Language: R
- Default Branch: master
- Homepage: https://business-science.github.io/tidyquant/
- Size: 184 MB
Statistics
- Stars: 887
- Watchers: 72
- Forks: 183
- Open Issues: 90
- Releases: 3
Topics
dplyr
financial-analysis
financial-data
financial-statements
multiple-stocks
performance-analysis
performanceanalytics
quantmod
r-package
stock
stock-exchanges
stock-indexes
stock-lists
stock-performance
stock-prices
stock-symbol
tidyverse
time-series
timeseries
xts
Created over 9 years ago
· Last pushed 12 months ago
Metadata Files
Readme
Changelog
License
README.Rmd
---
output: github_document
---
```{r, echo = FALSE, message = FALSE, warning=F}
knitr::opts_chunk$set(
collapse = TRUE,
comment = "#>",
fig.path = "man/figures/README-",
out.width = "100%",
dpi = 300,
message = F,
warning = F
)
```
# tidyquant  [](https://github.com/business-science/tidyquant/actions/workflows/R-CMD-check.yaml)
[](https://app.codecov.io/gh/business-science/tidyquant)
[](https://cran.r-project.org/package=tidyquant)


> Bringing financial and business analysis to the `tidyverse` in R.
Mission: Our number 1 goal is to make financial analysis easier in R. We've designed `tidyquant` to give you the flexibility of the tidyverse with the performance of the R `xts` system. The result: easier, faster, and more scalable financial analysis.
## Start: 2-Minutes To tidyquant
Our short introduction to `tidyquant` on
[YouTube](https://www.youtube.com/embed/woxJZTL2hok).
[](https://github.com/business-science/tidyquant/actions/workflows/R-CMD-check.yaml)
[](https://app.codecov.io/gh/business-science/tidyquant)
[](https://cran.r-project.org/package=tidyquant)


> Bringing financial and business analysis to the `tidyverse` in R.
Mission: Our number 1 goal is to make financial analysis easier in R. We've designed `tidyquant` to give you the flexibility of the tidyverse with the performance of the R `xts` system. The result: easier, faster, and more scalable financial analysis.
## Start: 2-Minutes To tidyquant
Our short introduction to `tidyquant` on
[YouTube](https://www.youtube.com/embed/woxJZTL2hok).
 # Features of tidyquant
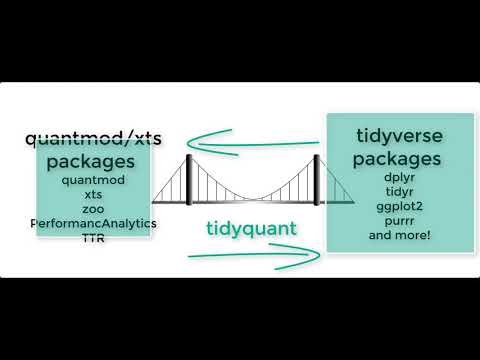
`tidyquant` integrates the best resources for collecting and analyzing financial data, `zoo`, `xts`, `quantmod`, `TTR`, and `PerformanceAnalytics`, with the tidy data infrastructure of the `tidyverse` allowing for seamless interaction between each. You can now perform complete financial analyses in the `tidyverse`.
* __A few core functions with a lot of power__
* __Integrates the quantitative analysis functionality of `zoo`, `xts`, `quantmod`, `TTR`, and _now_ `PerformanceAnalytics`__
* __Designed for modeling and scaling analyses using the `tidyverse` tools in [_R for Data Science_](https://r4ds.hadley.nz/)__
* __Implements `ggplot2` functionality for beautiful and meaningful financial visualizations__
* __User-friendly documentation to get you up to speed quickly!__
### New Excel Functionality in tidyquant
- [__Excel in R - Pivot Tables, VLOOKUPs, and more__](https://www.business-science.io/finance/2020/02/26/r-for-excel-users.html): Details on the __Excel integrations__ are covered in the blog article.
## One-Stop Shop for Serious Financial Analysis
With `tidyquant` all the benefits add up to one thing: _a one-stop shop for serious financial analysis!_
### Core Functions
* __Getting Financial Data from the web: `tq_get()`__. This is a one-stop shop for getting web-based financial data in a "tidy" data frame format. Get data for daily stock prices (historical), key statistics (real-time), key ratios (historical), financial statements, dividends, splits, economic data from the FRED, FOREX rates from Oanda.
* __Manipulating Financial Data: `tq_transmute()` and `tq_mutate()`__. Integration for many financial functions from `xts`, `zoo`, `quantmod`,`TTR` and `PerformanceAnalytics` packages. `tq_mutate()` is used to add a column to the data frame, and `tq_transmute()` is used to return a new data frame which is necessary for periodicity changes.
* __Performance Analysis and Portfolio Analysis: `tq_performance()` and `tq_portfolio()`__. The newest additions to the `tidyquant` family integrate `PerformanceAnalytics` functions. `tq_performance()` converts investment returns into performance metrics. `tq_portfolio()` aggregates a group (or multiple groups) of asset returns into one or more portfolios.
### Comparing Stock Prices
Visualizing the stock price volatility of four stocks side-by-side is quick and easy...
```{r echo=FALSE, out.width='100%'}
knitr::include_graphics("man/figures/sample_img_1_volatility.png")
```
### Evaluating Stock Performance
What about stock performance? Quickly visualize how a $10,000 investment in various stocks would perform.
```{r echo=FALSE, out.width='100%'}
knitr::include_graphics("man/figures/sample_img_2_stock_returns.png")
```
### Evaluating Portfolio Performance
Ok, stocks are too easy. What about portfolios? With the `PerformanceAnalytics` integration, visualizing blended portfolios are easy too!
* Portfolio 1: 50% FB, 25% AMZN, 25% NFLX, 0% GOOG
* Portfolio 2: 0% FB, 50% AMZN, 25% NFLX, 25% GOOG
* Portfolio 3: 25% FB, 0% AMZN, 50% NFLX, 25% GOOG
* Portfolio 4: 25% FB, 25% AMZN, 0% NFLX, 50% GOOG
```{r echo=FALSE, out.width='100%'}
knitr::include_graphics("man/figures/sample_img_3_portfolio_returns.png")
```
This just scratches the surface of `tidyquant`. Here's how to install to get started.
## Installation
Development Version with Latest Features:
``` {r, eval = FALSE}
# install.packages("devtools")
devtools::install_github("business-science/tidyquant")
```
CRAN Approved Version:
```{r, eval = FALSE}
install.packages("tidyquant")
```
## Further Information
The `tidyquant` package includes several vignettes to help users get up to speed quickly:
* [TQ00 - Introduction to `tidyquant`](https://business-science.github.io/tidyquant/articles/TQ00-introduction-to-tidyquant.html)
* [TQ01 - Core Functions in `tidyquant`](https://business-science.github.io/tidyquant/articles/TQ01-core-functions-in-tidyquant.html)
* [TQ02 - R Quantitative Analysis Package Integrations in `tidyquant`](https://business-science.github.io/tidyquant/articles/TQ02-quant-integrations-in-tidyquant.html)
* [TQ03 - Scaling and Modeling with `tidyquant`](https://business-science.github.io/tidyquant/articles/TQ03-scaling-and-modeling-with-tidyquant.html)
* [TQ04 - Charting with `tidyquant`](https://business-science.github.io/tidyquant/articles/TQ04-charting-with-tidyquant.html)
* [TQ05 - Performance Analysis with `tidyquant`](https://business-science.github.io/tidyquant/articles/TQ05-performance-analysis-with-tidyquant.html)
* [Blog Article: Excel in R - Pivot Tables, VLOOKUPs, and more!](https://www.business-science.io/finance/2020/02/26/r-for-excel-users.html)
# Want to Learn tidyquant?
- [Learning Lab #9:](https://university.business-science.io/p/learning-labs-pro)
- __Performance Analysis & Portfolio Optimization with `tidyquant`__ - A 1-hour course on `tidyquant` in Learning Labs PRO
- [Learning Lab #10:](https://university.business-science.io/p/learning-labs-pro)
- __Building an API with `plumber`__ - Build a stock optimization API with `plumber` and `tidyquant`
- [Learning Lab #16:](https://university.business-science.io/p/learning-labs-pro)
- __Stock Portfolio Optimization and Nonlinear Programming__ - Use the `ROI` package with `tidyquant` to calculate optimal minimum variance portfolios and develop an efficient frontier.
- [Learning Lab #30:](https://university.business-science.io/courses/learning-labs-pro/lectures/14630075)
- __Shiny Financial Analysis with Tidyquant API & Excel Pivot Tables__ - Learn how to use the new Excel Functionality to make Pivot Tables, VLOOKUPs, Sum-If's, and more!
# Features of tidyquant
`tidyquant` integrates the best resources for collecting and analyzing financial data, `zoo`, `xts`, `quantmod`, `TTR`, and `PerformanceAnalytics`, with the tidy data infrastructure of the `tidyverse` allowing for seamless interaction between each. You can now perform complete financial analyses in the `tidyverse`.
* __A few core functions with a lot of power__
* __Integrates the quantitative analysis functionality of `zoo`, `xts`, `quantmod`, `TTR`, and _now_ `PerformanceAnalytics`__
* __Designed for modeling and scaling analyses using the `tidyverse` tools in [_R for Data Science_](https://r4ds.hadley.nz/)__
* __Implements `ggplot2` functionality for beautiful and meaningful financial visualizations__
* __User-friendly documentation to get you up to speed quickly!__
### New Excel Functionality in tidyquant
- [__Excel in R - Pivot Tables, VLOOKUPs, and more__](https://www.business-science.io/finance/2020/02/26/r-for-excel-users.html): Details on the __Excel integrations__ are covered in the blog article.
## One-Stop Shop for Serious Financial Analysis
With `tidyquant` all the benefits add up to one thing: _a one-stop shop for serious financial analysis!_
### Core Functions
* __Getting Financial Data from the web: `tq_get()`__. This is a one-stop shop for getting web-based financial data in a "tidy" data frame format. Get data for daily stock prices (historical), key statistics (real-time), key ratios (historical), financial statements, dividends, splits, economic data from the FRED, FOREX rates from Oanda.
* __Manipulating Financial Data: `tq_transmute()` and `tq_mutate()`__. Integration for many financial functions from `xts`, `zoo`, `quantmod`,`TTR` and `PerformanceAnalytics` packages. `tq_mutate()` is used to add a column to the data frame, and `tq_transmute()` is used to return a new data frame which is necessary for periodicity changes.
* __Performance Analysis and Portfolio Analysis: `tq_performance()` and `tq_portfolio()`__. The newest additions to the `tidyquant` family integrate `PerformanceAnalytics` functions. `tq_performance()` converts investment returns into performance metrics. `tq_portfolio()` aggregates a group (or multiple groups) of asset returns into one or more portfolios.
### Comparing Stock Prices
Visualizing the stock price volatility of four stocks side-by-side is quick and easy...
```{r echo=FALSE, out.width='100%'}
knitr::include_graphics("man/figures/sample_img_1_volatility.png")
```
### Evaluating Stock Performance
What about stock performance? Quickly visualize how a $10,000 investment in various stocks would perform.
```{r echo=FALSE, out.width='100%'}
knitr::include_graphics("man/figures/sample_img_2_stock_returns.png")
```
### Evaluating Portfolio Performance
Ok, stocks are too easy. What about portfolios? With the `PerformanceAnalytics` integration, visualizing blended portfolios are easy too!
* Portfolio 1: 50% FB, 25% AMZN, 25% NFLX, 0% GOOG
* Portfolio 2: 0% FB, 50% AMZN, 25% NFLX, 25% GOOG
* Portfolio 3: 25% FB, 0% AMZN, 50% NFLX, 25% GOOG
* Portfolio 4: 25% FB, 25% AMZN, 0% NFLX, 50% GOOG
```{r echo=FALSE, out.width='100%'}
knitr::include_graphics("man/figures/sample_img_3_portfolio_returns.png")
```
This just scratches the surface of `tidyquant`. Here's how to install to get started.
## Installation
Development Version with Latest Features:
``` {r, eval = FALSE}
# install.packages("devtools")
devtools::install_github("business-science/tidyquant")
```
CRAN Approved Version:
```{r, eval = FALSE}
install.packages("tidyquant")
```
## Further Information
The `tidyquant` package includes several vignettes to help users get up to speed quickly:
* [TQ00 - Introduction to `tidyquant`](https://business-science.github.io/tidyquant/articles/TQ00-introduction-to-tidyquant.html)
* [TQ01 - Core Functions in `tidyquant`](https://business-science.github.io/tidyquant/articles/TQ01-core-functions-in-tidyquant.html)
* [TQ02 - R Quantitative Analysis Package Integrations in `tidyquant`](https://business-science.github.io/tidyquant/articles/TQ02-quant-integrations-in-tidyquant.html)
* [TQ03 - Scaling and Modeling with `tidyquant`](https://business-science.github.io/tidyquant/articles/TQ03-scaling-and-modeling-with-tidyquant.html)
* [TQ04 - Charting with `tidyquant`](https://business-science.github.io/tidyquant/articles/TQ04-charting-with-tidyquant.html)
* [TQ05 - Performance Analysis with `tidyquant`](https://business-science.github.io/tidyquant/articles/TQ05-performance-analysis-with-tidyquant.html)
* [Blog Article: Excel in R - Pivot Tables, VLOOKUPs, and more!](https://www.business-science.io/finance/2020/02/26/r-for-excel-users.html)
# Want to Learn tidyquant?
- [Learning Lab #9:](https://university.business-science.io/p/learning-labs-pro)
- __Performance Analysis & Portfolio Optimization with `tidyquant`__ - A 1-hour course on `tidyquant` in Learning Labs PRO
- [Learning Lab #10:](https://university.business-science.io/p/learning-labs-pro)
- __Building an API with `plumber`__ - Build a stock optimization API with `plumber` and `tidyquant`
- [Learning Lab #16:](https://university.business-science.io/p/learning-labs-pro)
- __Stock Portfolio Optimization and Nonlinear Programming__ - Use the `ROI` package with `tidyquant` to calculate optimal minimum variance portfolios and develop an efficient frontier.
- [Learning Lab #30:](https://university.business-science.io/courses/learning-labs-pro/lectures/14630075)
- __Shiny Financial Analysis with Tidyquant API & Excel Pivot Tables__ - Learn how to use the new Excel Functionality to make Pivot Tables, VLOOKUPs, Sum-If's, and more!
Owner
- Name: Business Science
- Login: business-science
- Kind: organization
- Email: info@business-science.io
- Location: United States of America
- Website: www.business-science.io
- Repositories: 36
- Profile: https://github.com/business-science
Applying data science to business & financial analysis, tw: @bizScienc
GitHub Events
Total
- Create event: 1
- Release event: 1
- Issues event: 11
- Watch event: 41
- Issue comment event: 4
- Push event: 28
- Pull request event: 1
- Fork event: 8
Last Year
- Create event: 1
- Release event: 1
- Issues event: 11
- Watch event: 41
- Issue comment event: 4
- Push event: 28
- Pull request event: 1
- Fork event: 8
Committers
Last synced: about 1 year ago
Top Committers
| Name | Commits | |
|---|---|---|
| Matt Dancho | m****o@g****m | 338 |
| DavisVaughan | m****5@u****u | 121 |
| olivroy | o****1@h****m | 43 |
| DavisVaughan | d****s@r****m | 11 |
| martin | m****n@g****m | 2 |
| Scott Graham | s****5@g****m | 1 |
| Hadley Wickham | h****m@g****m | 1 |
| Andre Mueller | a****e@k****e | 1 |
| Haowen Wang | h****2@b****u | 1 |
| JensWahl | j****l@n****o | 1 |
| Gabor Nagy | g****y@s****g | 1 |
Committer Domains (Top 20 + Academic)
Issues and Pull Requests
Last synced: 11 months ago
All Time
- Total issues: 113
- Total pull requests: 18
- Average time to close issues: 9 months
- Average time to close pull requests: 11 months
- Total issue authors: 84
- Total pull request authors: 13
- Average comments per issue: 2.16
- Average comments per pull request: 1.17
- Merged pull requests: 9
- Bot issues: 0
- Bot pull requests: 0
Past Year
- Issues: 10
- Pull requests: 2
- Average time to close issues: about 18 hours
- Average time to close pull requests: about 13 hours
- Issue authors: 6
- Pull request authors: 1
- Average comments per issue: 0.3
- Average comments per pull request: 0.0
- Merged pull requests: 1
- Bot issues: 0
- Bot pull requests: 0
Top Authors
Issue Authors
- mdancho84 (11)
- dm319 (4)
- spsanderson (3)
- IanWorthington (3)
- kaybenleroll (2)
- nitingupta2 (2)
- waynelapierre (2)
- mcfsalla (2)
- ecitera (2)
- joshuaulrich (2)
- siegfried (2)
- eweiss99 (2)
- Sbirch556 (2)
- dougedmunds (2)
- niheaven (2)
Pull Request Authors
- olivroy (5)
- HaowenWang-hww (2)
- tomlane1993 (1)
- JensWahl (1)
- mgei (1)
- dgrtwo (1)
- hadley (1)
- jilmun (1)
- jarodmeng (1)
- beniamino98 (1)
- gwd666 (1)
- jmuhlenkamp (1)
- chriscardillo (1)
Top Labels
Issue Labels
help wanted (4)
enhancement (3)
bug (2)
Pull Request Labels
Packages
- Total packages: 2
-
Total downloads:
- cran 12,918 last-month
- Total docker downloads: 24,582
-
Total dependent packages: 13
(may contain duplicates) -
Total dependent repositories: 47
(may contain duplicates) - Total versions: 34
- Total maintainers: 1
cran.r-project.org: tidyquant
Tidy Quantitative Financial Analysis
- Homepage: https://business-science.github.io/tidyquant/
- Documentation: http://cran.r-project.org/web/packages/tidyquant/tidyquant.pdf
- License: MIT + file LICENSE
-
Latest release: 1.0.11
published over 1 year ago
Rankings
Stargazers count: 0.3%
Forks count: 0.4%
Downloads: 2.6%
Dependent repos count: 3.7%
Dependent packages count: 4.3%
Average: 5.6%
Docker downloads count: 22.3%
Maintainers (1)
Last synced:
11 months ago
conda-forge.org: r-tidyquant
- Homepage: https://business-science.github.io/tidyquant/
- License: MIT
-
Latest release: 1.0.5
published almost 4 years ago
Rankings
Forks count: 14.1%
Stargazers count: 14.3%
Dependent repos count: 24.4%
Average: 26.1%
Dependent packages count: 51.6%
Last synced:
11 months ago
Dependencies
DESCRIPTION
cran
- PerformanceAnalytics * depends
- R >= 3.5.0 depends
- lubridate * depends
- quantmod >= 0.4 depends
- Quandl * imports
- TTR * imports
- alphavantager >= 0.1.2 imports
- curl * imports
- dplyr >= 1.0.0 imports
- ggplot2 * imports
- httr * imports
- jsonlite * imports
- lazyeval * imports
- magrittr * imports
- purrr * imports
- readr * imports
- riingo * imports
- rlang * imports
- stringr * imports
- tibble * imports
- tidyr >= 1.0.0 imports
- tidyselect * imports
- timeDate * imports
- timetk >= 2.4.0 imports
- xts * imports
- Rblpapi * suggests
- broom * suggests
- covr * suggests
- forcats * suggests
- janitor * suggests
- knitr * suggests
- readxl * suggests
- rmarkdown * suggests
- scales * suggests
- testthat >= 2.1.0 suggests
- tibbletime * suggests
- tidyverse * suggests
.github/workflows/R-CMD-check.yaml
actions
- actions/checkout v2 composite
- actions/upload-artifact main composite
- r-lib/actions/check-r-package v1 composite
- r-lib/actions/setup-pandoc v1 composite
- r-lib/actions/setup-r v1 composite
- r-lib/actions/setup-r-dependencies v1 composite
.github/workflows/pkgdown.yaml
actions
- actions/checkout v2 composite
- r-lib/actions/setup-pandoc v1 composite
- r-lib/actions/setup-r v1 composite
- r-lib/actions/setup-r-dependencies v1 composite
.github/workflows/pr-commands.yaml
actions
- actions/checkout v2 composite
- r-lib/actions/pr-fetch v1 composite
- r-lib/actions/pr-push v1 composite
- r-lib/actions/setup-r v1 composite
- r-lib/actions/setup-r-dependencies v1 composite
.github/workflows/test-coverage.yaml
actions
- actions/checkout v2 composite
- r-lib/actions/setup-r v1 composite
- r-lib/actions/setup-r-dependencies v1 composite