Science Score: 26.0%
This score indicates how likely this project is to be science-related based on various indicators:
-
○CITATION.cff file
-
✓codemeta.json file
Found codemeta.json file -
✓.zenodo.json file
Found .zenodo.json file -
○DOI references
-
○Academic publication links
-
○Committers with academic emails
-
○Institutional organization owner
-
○JOSS paper metadata
-
○Scientific vocabulary similarity
Low similarity (11.1%) to scientific vocabulary
Keywords
Repository
an R package for beginners
Basic Info
- Host: GitHub
- Owner: pzhaonet
- License: other
- Language: R
- Default Branch: master
- Size: 94.7 KB
Statistics
- Stars: 15
- Watchers: 3
- Forks: 6
- Open Issues: 0
- Releases: 2
Topics
Metadata Files
readme.md
Introduction
‘beginr’ is a collection of useful functions for R beginners, including hints for the arguments of the ‘plot()’ function, self-defined functions for error bars, user-customized pair plots and hist plots, enhanced linear regression figures, etc.. This package could be helpful to R experts as well.
Installation
# stable version on CRAN
install.package("beginr")
# or development version on GitHub
devtools::install_github("pzhaonet/beginr")
Quick Start
Functions as Memos
If you often forget the options for pch, lty, type, and col when you plot(), you can run plotpch(), plotlty(), plottype(), plotcolors(), and plotcolorbar(). No need to search the internet any more.
beginr::plotpch()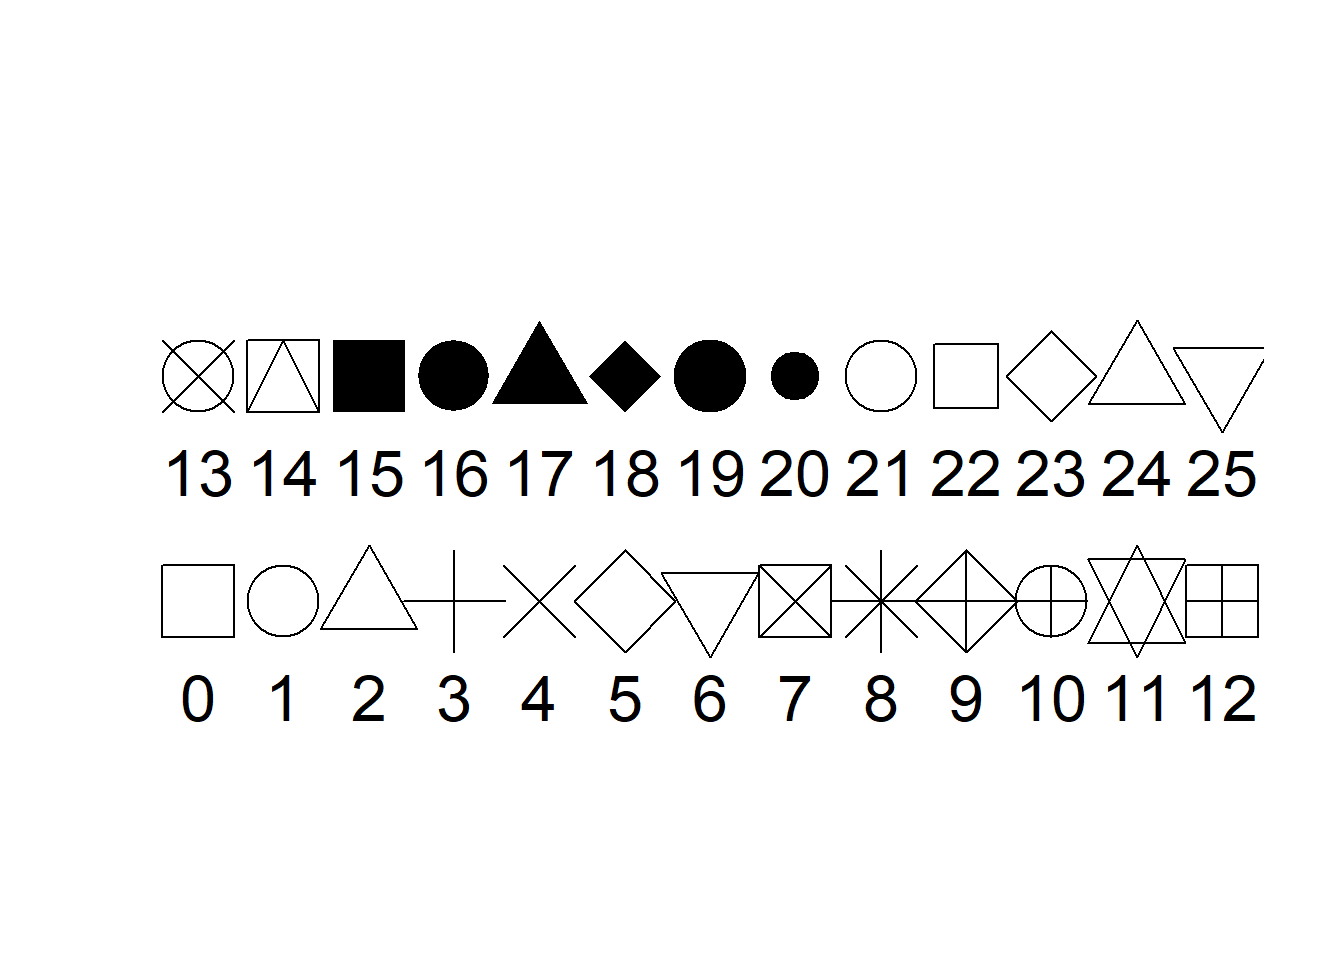
beginr::plotlty()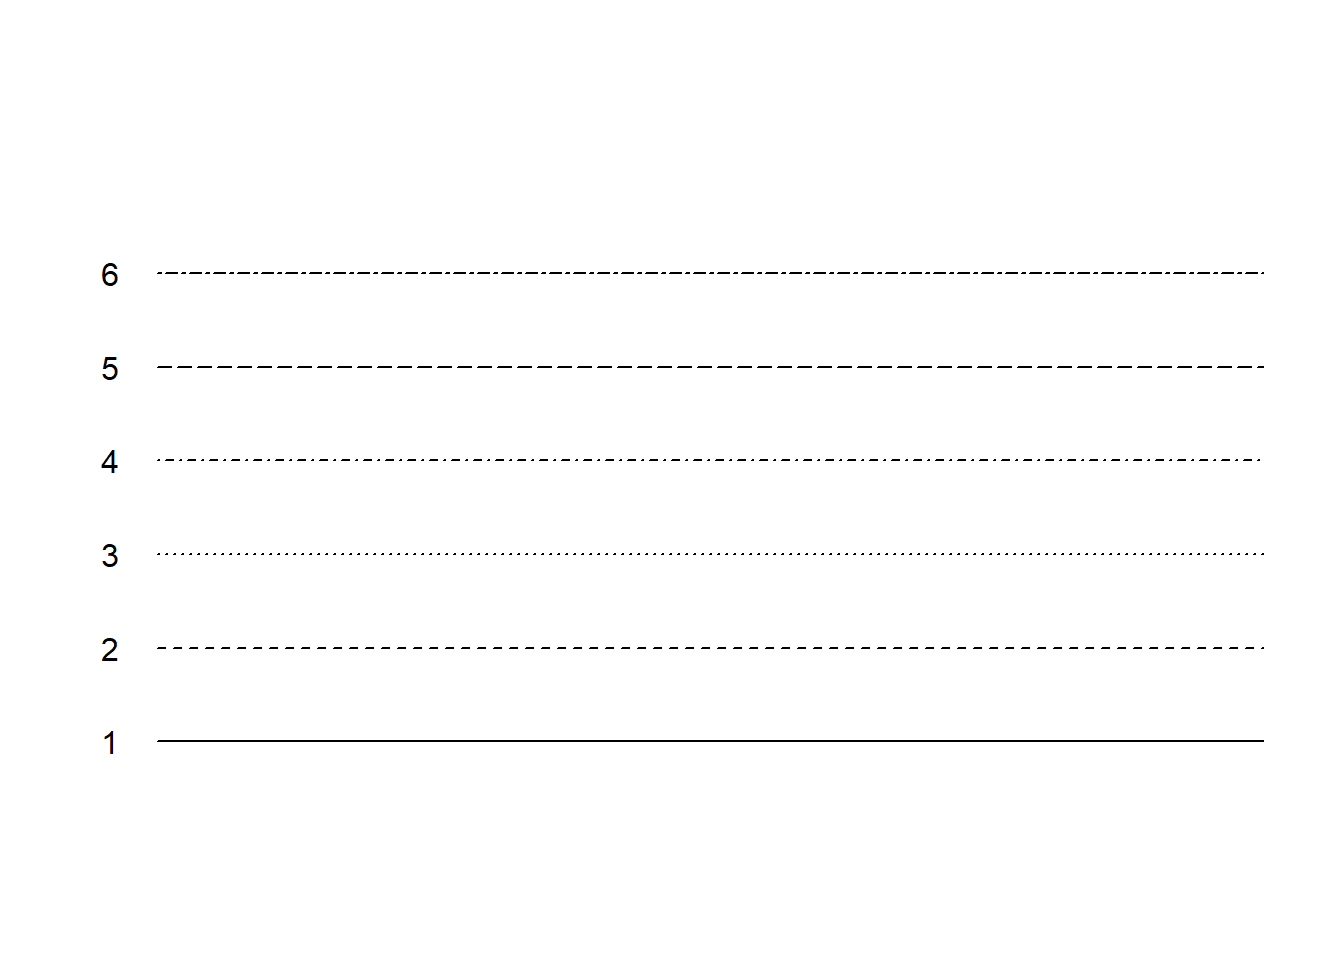
beginr::plottype()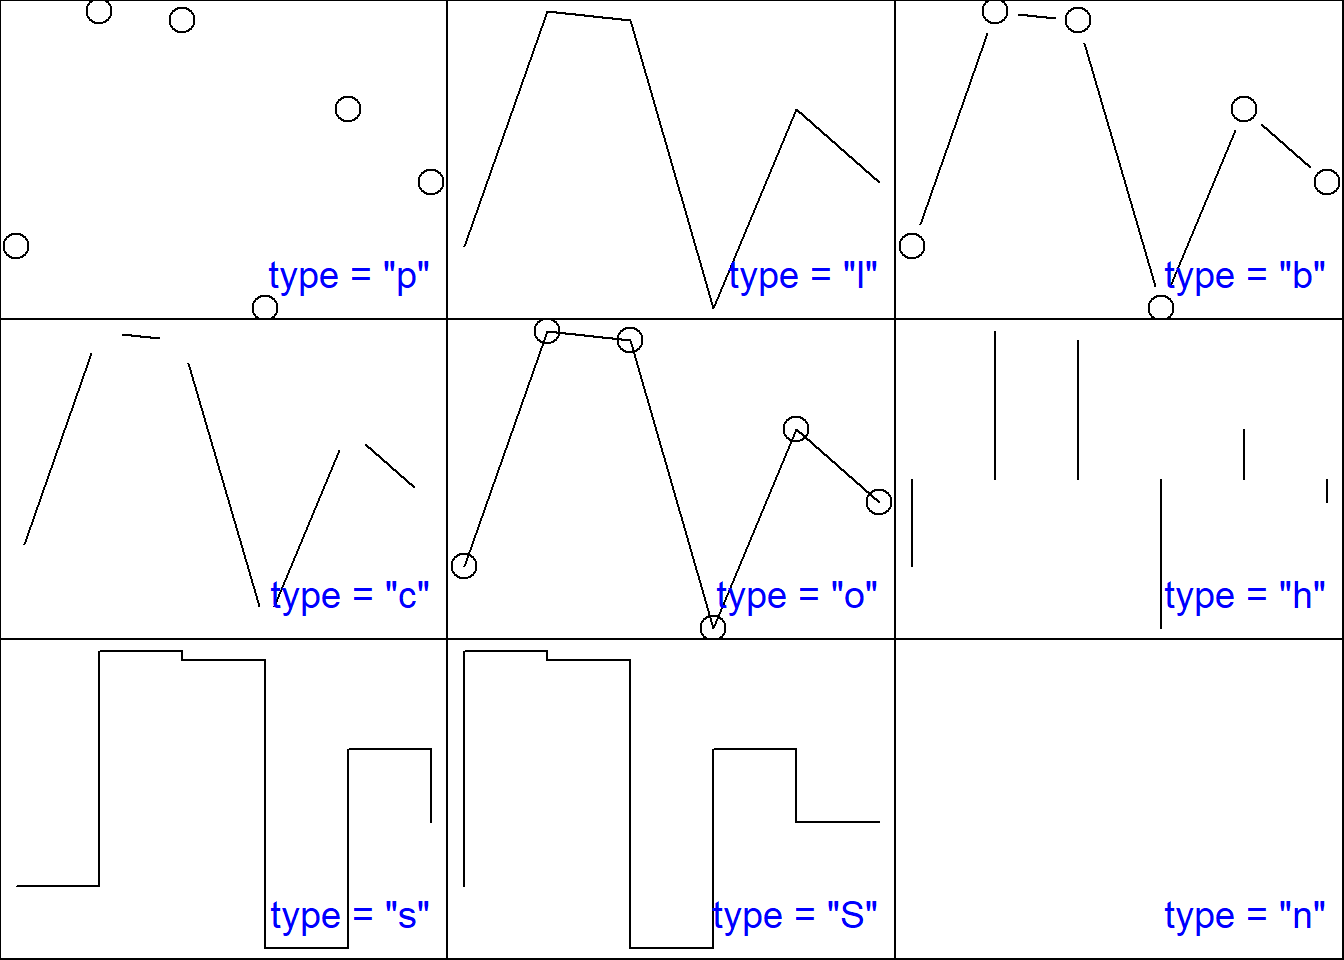
beginr::plotcolors()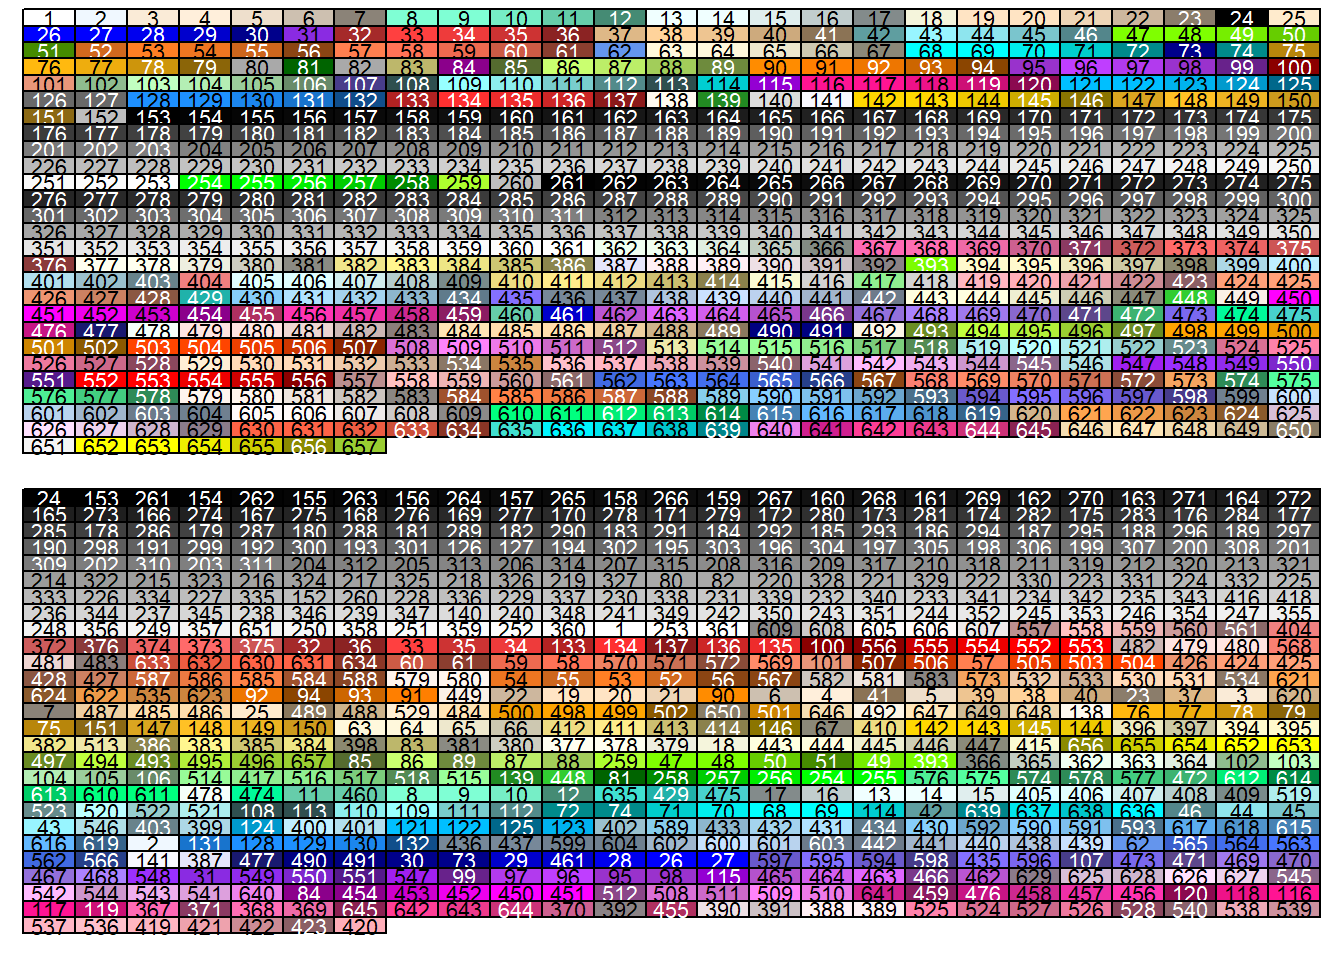
beginr::plotcolorbar()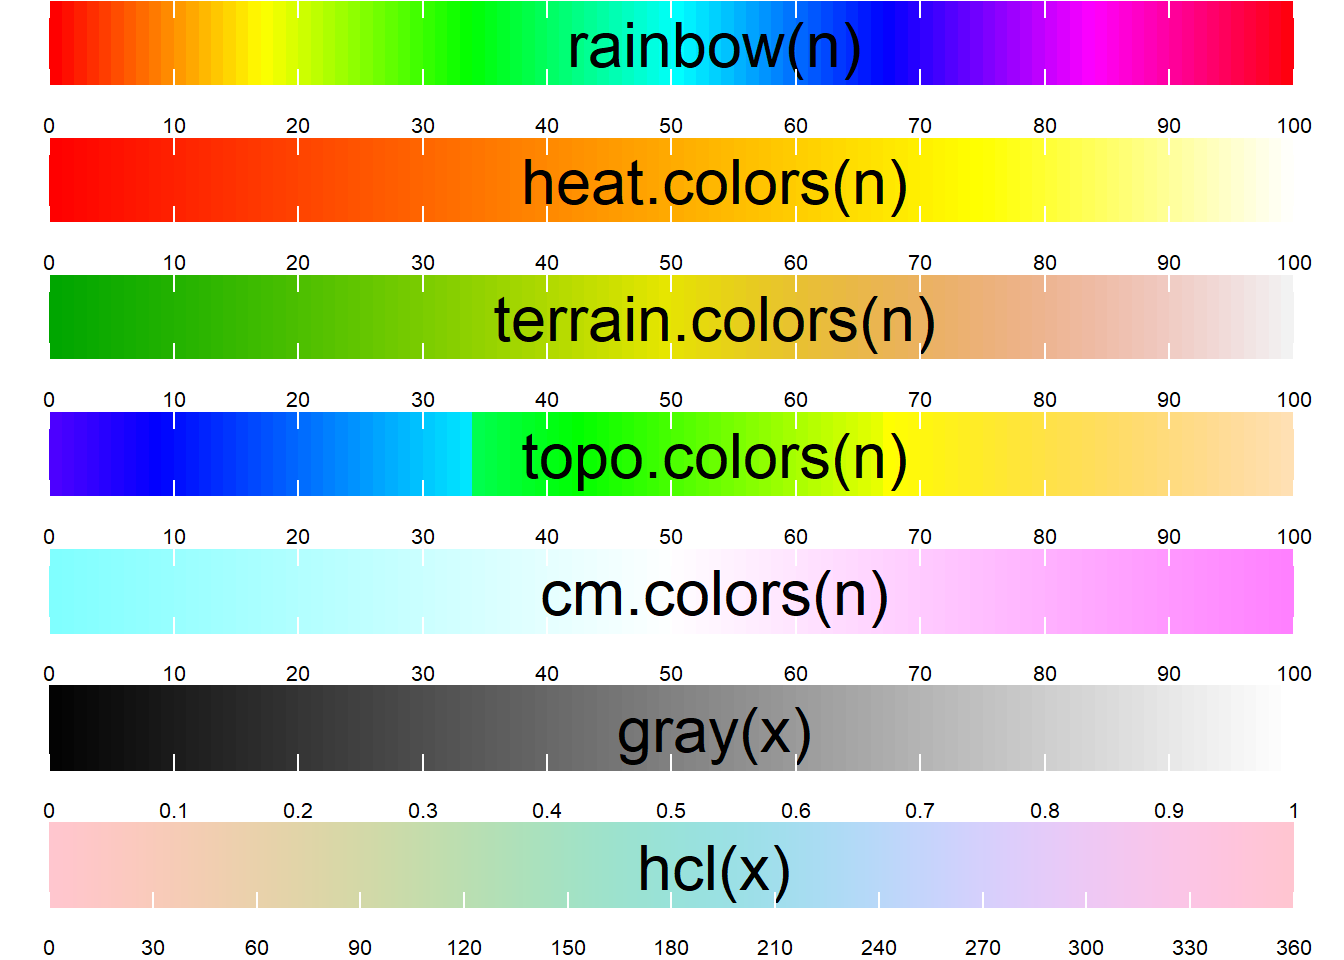
Functions for Easy Plotting
Linear regression is often used in scientific work, but it is annoying to display the results. In R you have to run lm(), plot(), abline(), text() and so on and so forth. Now with ‘beginr’ you only have to run plotlm().
x <- 1:10
y <- 1:10 + rnorm(10)
beginr::plotlm(x, y)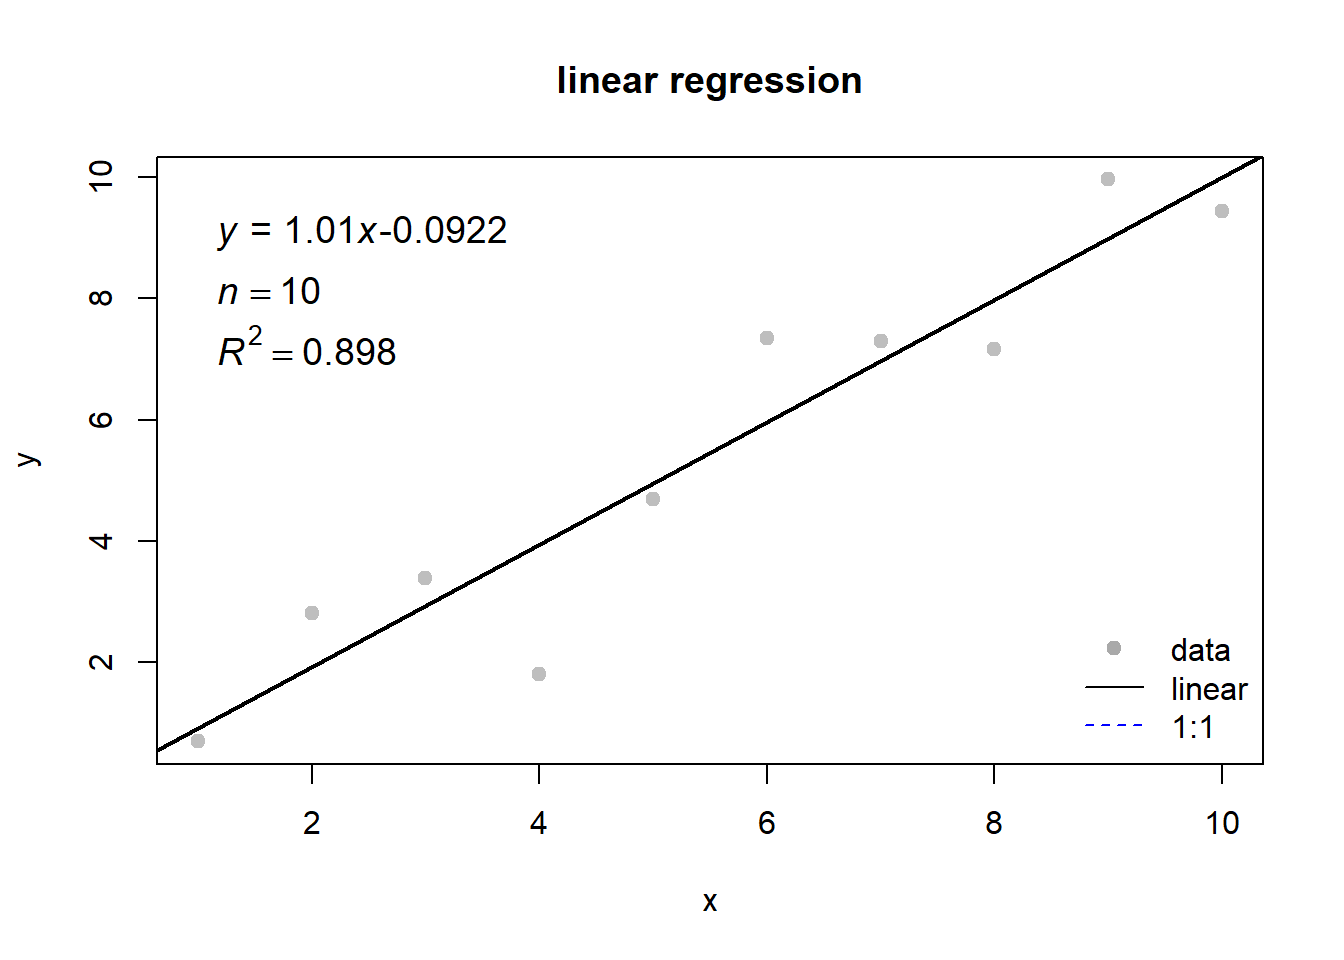
## [[1]]
##               Estimate Std. Error   t value     Pr(>|t|)
## (Intercept) -0.8826021 0.59514844 -1.482995 1.763634e-01
## x            1.1693736 0.09591686 12.191533 1.899987e-06
##
## [[2]]
## [1] 0.9489254
If you want to display the distribution of a data-set, use plothist(), which gives you a histogram with markers of the median, mean, quantiles, standard deviation, sample number and the skewness.
x <- rnorm(10000)
beginr::plothist(x)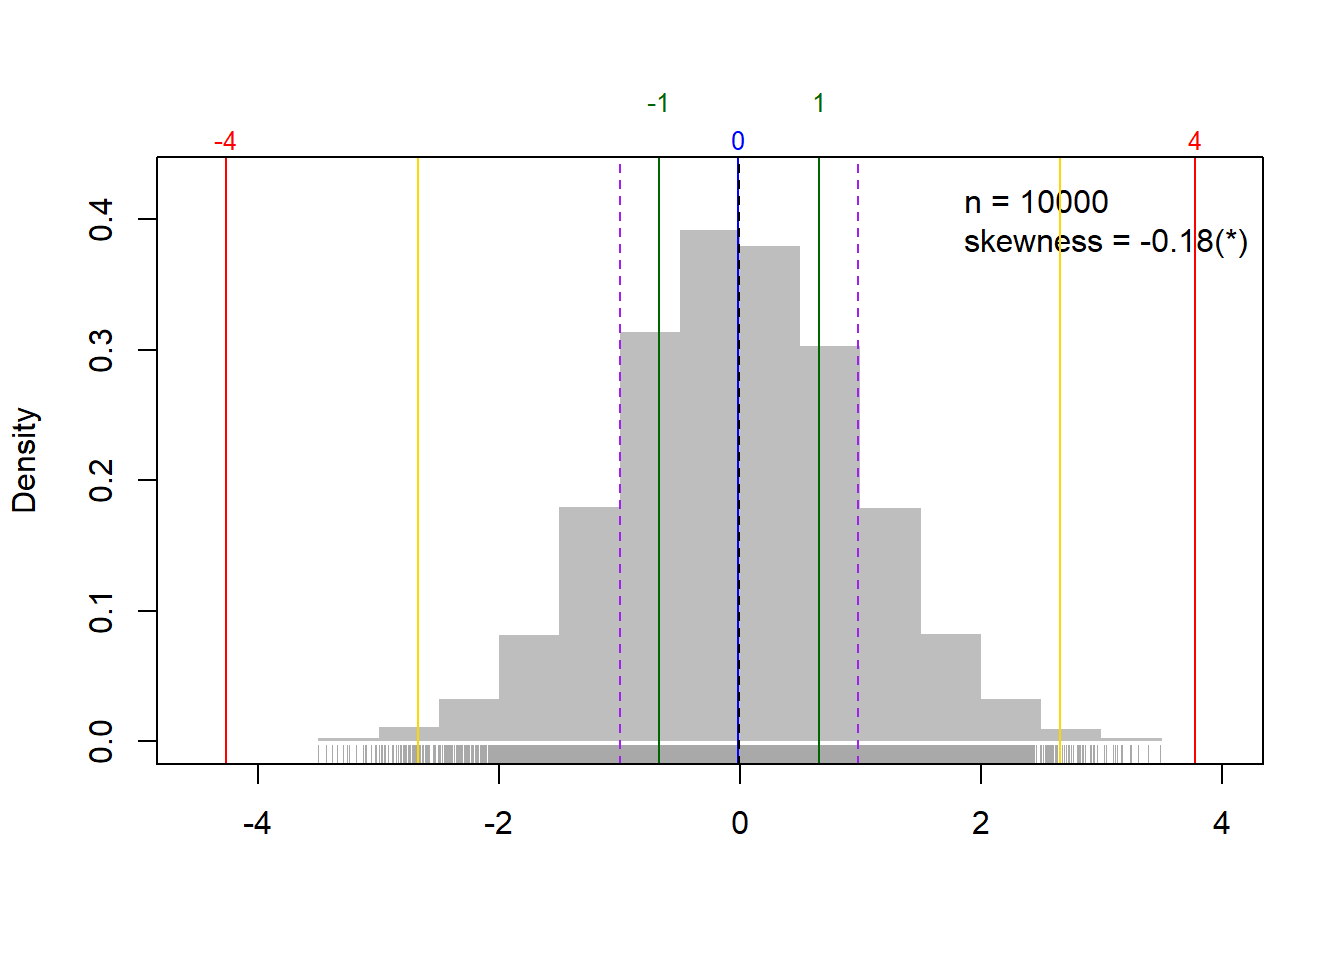
##     para         value
## 1    min -3.9594329262
## 2     1q -0.6743155802
## 3 median  0.0151220580
## 4     3q  0.6806285656
## 5    max  4.1576382225
## 6  lower -2.7065331755
## 7  upper  2.7128461609
## 8   mean -0.0005589431
## 9     sd  1.0064399683
I like pairs(), and ‘beginr’ gives more powerful features to plotpairs() and plotpairs2().
df <- data.frame(a = 1:10, b = 1:10 + rnorm(10), c = 1:10 + rnorm(10))
beginr::plotpairs(df)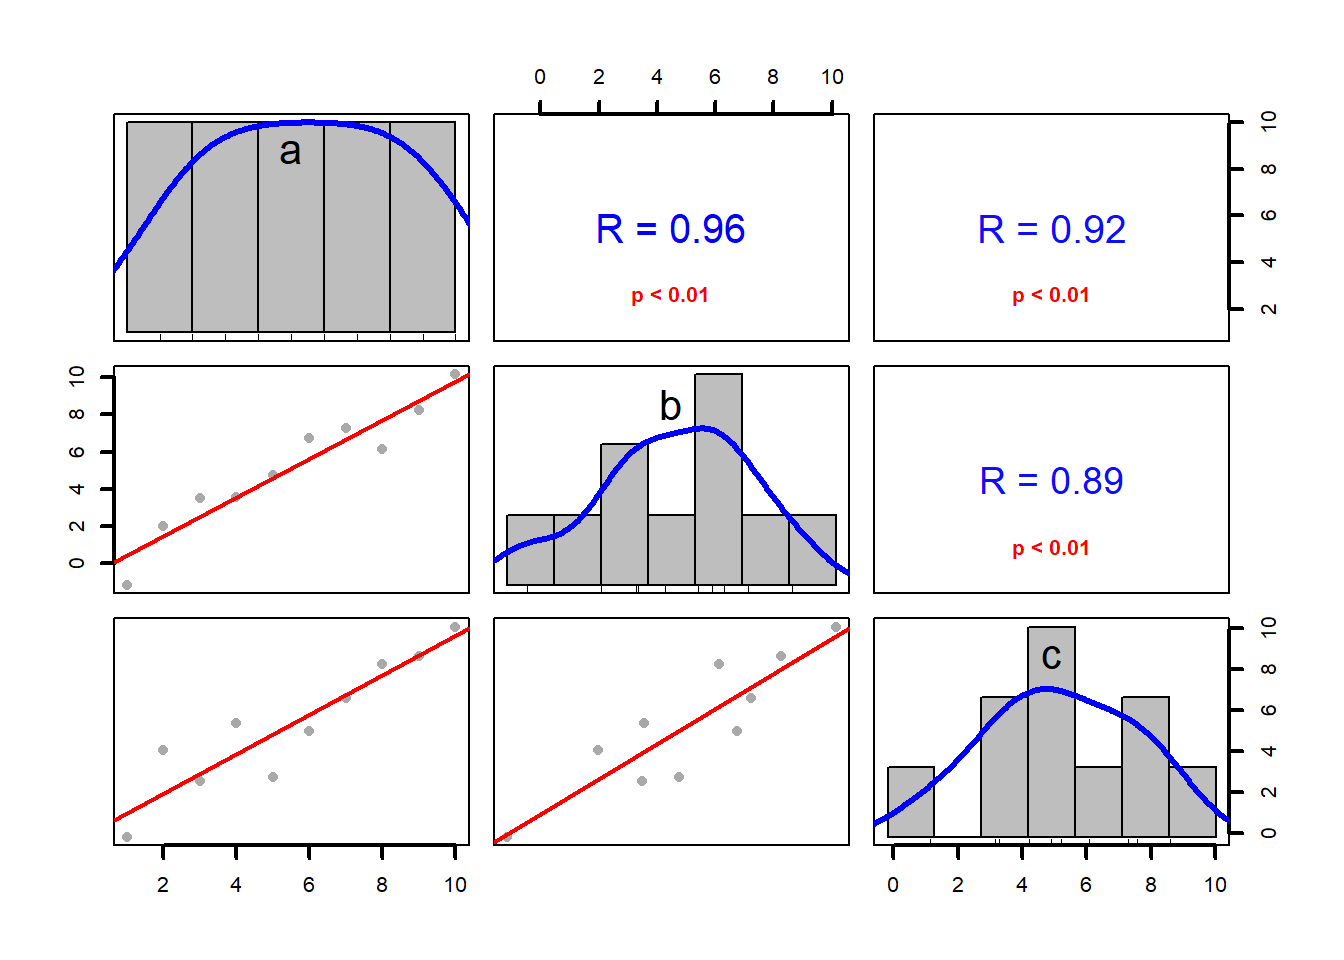
beginr::plotpairs2(df)## [1] "p<0.01"## [1] "p<0.01"## [1] "p<0.01"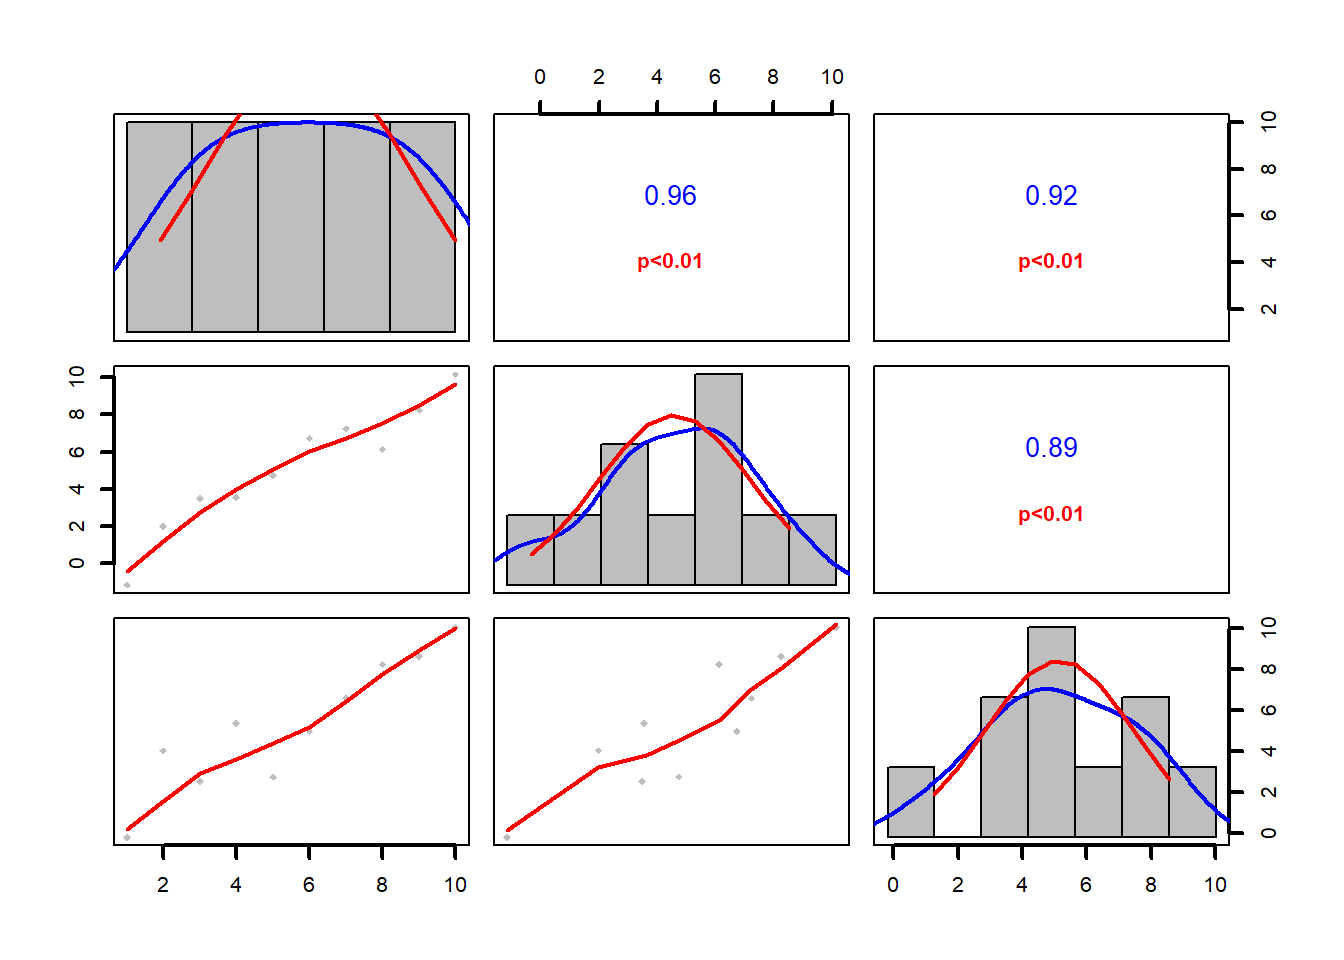
I often have to plot one independent variable (x) and multiple dependent variables (y1, y2, …, yn) in one 2-D coordinate system, or one dependent variable (y) against multiple independent variables (x1, x2, …, xn) with their error bars. Use dfplot() or dfplot2() in ‘beginr’.
x <- seq(0, 2 * pi, length.out = 100)
y <- data.frame(sin(x), cos(x))
yerror <- data.frame(abs(rnorm(100, sd = 0.3)), abs(rnorm(100, sd = 0.1)))
beginr::dfplot(x, y, yerror = yerror)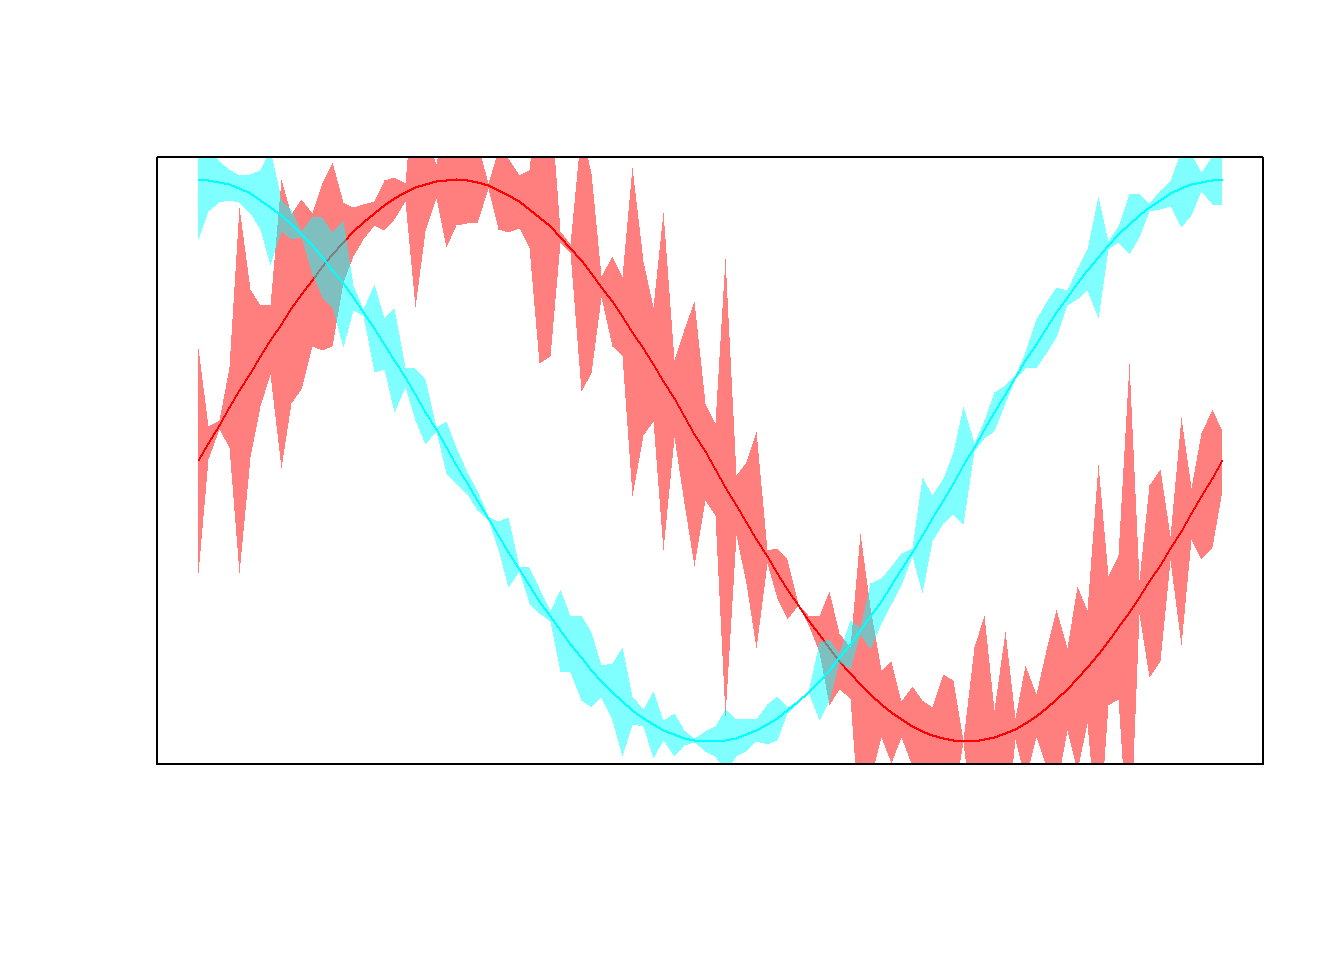
beginr::dfplot2(y, x, xerror = yerror)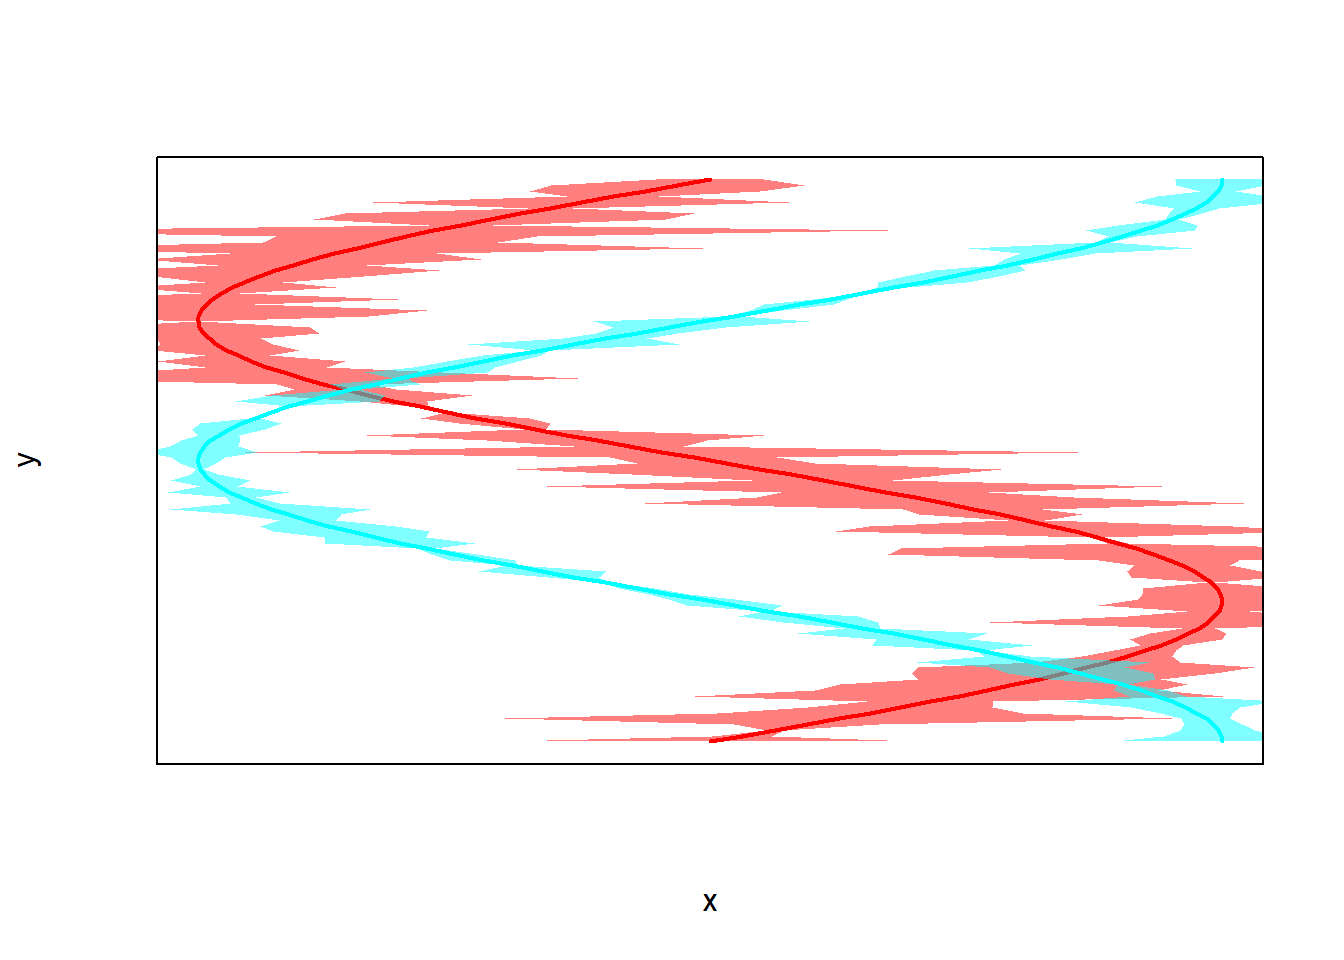
If you would like to add errorbars only, then use errorbar().
x <- seq(0, 2 * pi, length.out = 100)
y <- sin(x)
plot(x, y, type = "l")
beginr::errorbar(x, y, yupper = 0.1, ylower = 0.1)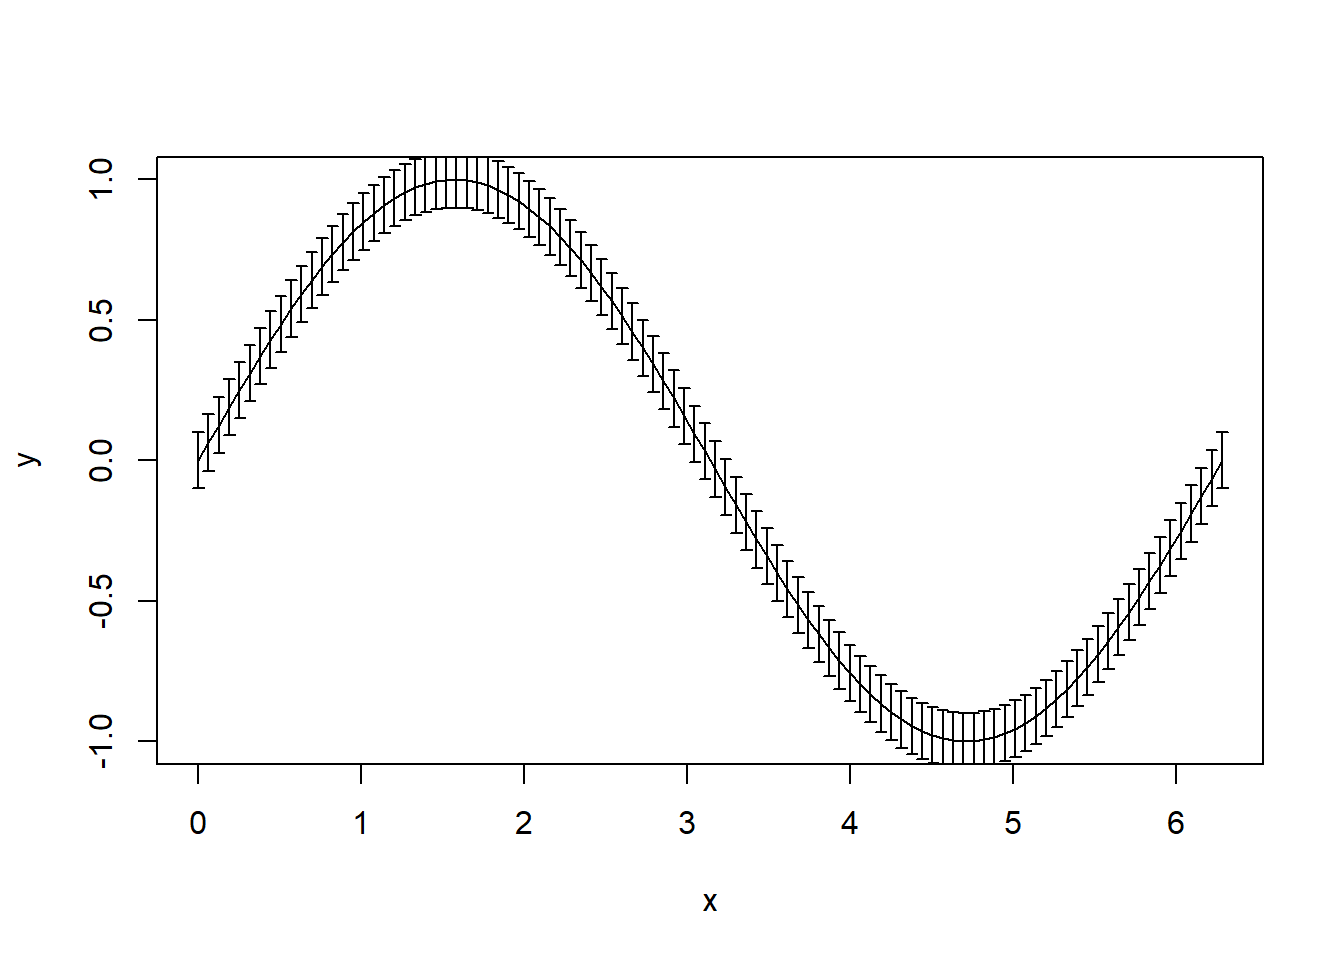
Functions for Data Frames
lmdf() performs the linear regression between every two columns in a data frame.
df <- data.frame(a = 1:10, b = 1:10 + rnorm(10), c = 1:10 + rnorm(10))
beginr::lmdf(df)
## x y r.squared adj.r.squared intercept slope Std.Error.intercept
## 1 a b 0.9630442 0.9584247 -0.7901086 1.1271749 0.4843895
## 2 a c 0.8568806 0.8389907 -0.3427519 1.0425054 0.9346580
## 3 b a 0.9630442 0.9584247 0.8783157 0.8543876 0.3749251
## 4 b c 0.8157952 0.7927696 0.6004724 0.8856059 0.9426967
## 5 c a 0.8568806 0.8389907 1.0688792 0.8219436 0.7466774
## 6 c b 0.8157952 0.7927696 0.4432909 0.9211717 0.9729768
## Std.Error.slope t.intercept t.slope Pr.intercept Pr.slope
## 1 0.07806644 -1.6311430 14.438661 0.14150586 5.177385e-07
## 2 0.15063377 -0.3667137 6.920795 0.72334232 1.219459e-04
## 3 0.05917360 2.3426432 14.438661 0.04722045 5.177385e-07
## 4 0.14878374 0.6369730 5.952303 0.54193651 3.410966e-04
## 5 0.11876434 1.4315142 6.920795 0.19016727 1.219459e-04
## 6 0.15475888 0.4556027 5.952303 0.66078732 3.410966e-04There are two functions as improvements of tapply() for factor calculation.
beginr::tapplydf()
beginr::tapplydfv()
Functions for Reading and Writing files
readdir() reads multiple files into a list.
beginr::readdir()writefile() avoids overwriting the files which already exist.
beginr::writefile()list2ascii() saves a list as a text file.
alist <- list(a = 1:10, b = letters)
beginr::list2ascii(alist)
Functions for Packages
bib() creates bibliographic entries as texts or a file (‘.bib’).
beginr::bib(pkg = c("mindr", "bookdownplus", "pinyin", "beginr"))## @Manual{R-beginr,
## title = {beginr: Functions for R Beginners},
## author = {Peng Zhao},
## year = {2017},
## note = {R package version 0.1.0},
## url = {https://github.com/pzhaonet/beginr},
## }
## @Manual{R-bookdownplus,
## title = {bookdownplus: Generate Varied Books and Documents with R 'bookdown' Package},
## author = {Peng Zhao},
## year = {2017},
## note = {R package version 1.2.2},
## url = {https://github.com/pzhaonet/bookdownplus},
## }
## @Manual{R-mindr,
## title = {mindr: Convert Files Between Markdown or Rmarkdown Files and Mindmaps},
## author = {Peng Zhao},
## year = {2017},
## note = {R package version 1.1.0},
## url = {https://github.com/pzhaonet/mindr},
## }
## @Manual{R-pinyin,
## title = {pinyin: Convert Chinese Characters into Pinyin},
## author = {Peng Zhao},
## year = {2017},
## note = {R package version 1.1.0},
## url = {https://github.com/pzhaonet/pinyin},
## }plotpkg() displays a figure showing the downloads of packages.
beginr::plotpkg("beginr", from = "2017-06-23")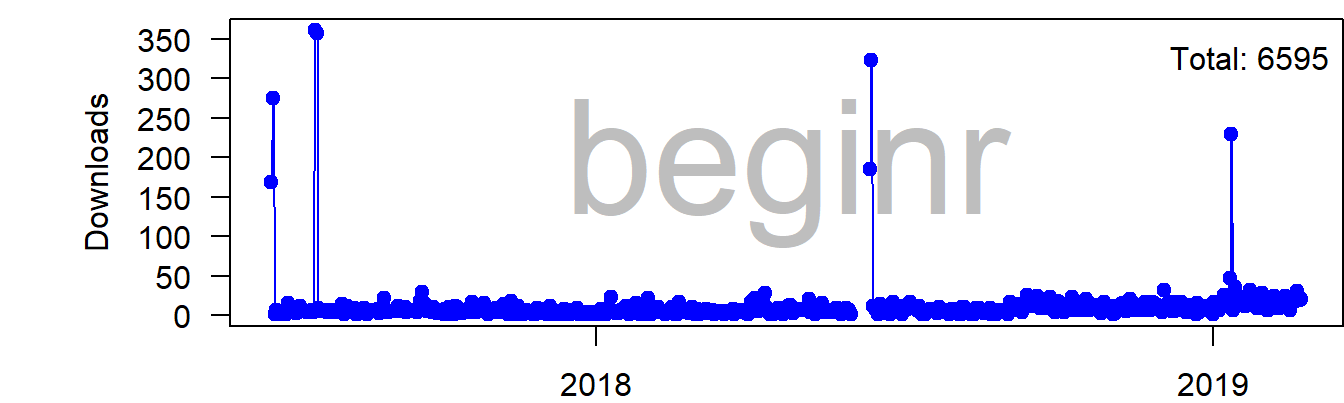
rpkg() creates a new R package in an easy way.
beginr::rpkg()Updates
- 2019-01-25. v0.1.5. New function
packr(). - 2019-01-05. v0.1.4. Enhanced
readdir(). - 2018-06-12. v0.1.3. the condition length in 'if()' was checked.
- 2017-11-22. v0.1.2. Bugs fixed.
- 2017-08-16. v0.1.1. Bugs fixed.
plothist()improved. - 2017-07-19. v0.1.0. Updated on CRAN. See the release note.
- 2017-07-04. v0.0.3. Two more functions:
plotcolorbar()andplotpkg(). - 2017-06-30. v0.0.2. One more function:
rpkg()to create a skeleton for creating a new R package. - 2017-06-23. v0.0.1. Released on CRAN.
- 2017-06-22. v0.0.0. Preliminary.
To do
- created a universal RStudio addin like rmd::rmdAddin() for agroup of packages.
References
Zhao, Peng. 2017. Beginr: Functions for R Beginners. https://github.com/pzhaonet/beginr.
Owner
- Name: Peng Zhao
- Login: pzhaonet
- Kind: user
- Location: Suzhou, China
- Company: Xi'an Jiaotong-Liverpool University
- Website: http://pzhao.org
- Repositories: 170
- Profile: https://github.com/pzhaonet
Assistant Professor in Environmental Science
GitHub Events
Total
Last Year
Committers
Last synced: about 1 year ago
Top Committers
| Name | Commits | |
|---|---|---|
| Peng Zhao | b****p@g****m | 17 |
| Peng Zhao | p****o@p****t | 7 |
| yiluheihei | y****i@g****m | 2 |
| Zhao | P****o@m****e | 2 |
Issues and Pull Requests
Last synced: about 1 year ago
All Time
- Total issues: 0
- Total pull requests: 2
- Average time to close issues: N/A
- Average time to close pull requests: about 23 hours
- Total issue authors: 0
- Total pull request authors: 1
- Average comments per issue: 0
- Average comments per pull request: 1.0
- Merged pull requests: 2
- Bot issues: 0
- Bot pull requests: 0
Past Year
- Issues: 0
- Pull requests: 0
- Average time to close issues: N/A
- Average time to close pull requests: N/A
- Issue authors: 0
- Pull request authors: 0
- Average comments per issue: 0
- Average comments per pull request: 0
- Merged pull requests: 0
- Bot issues: 0
- Bot pull requests: 0
Top Authors
Issue Authors
Pull Request Authors
- yiluheihei (2)
Top Labels
Issue Labels
Pull Request Labels
Packages
- Total packages: 1
-
Total downloads:
- cran 512 last-month
- Total dependent packages: 0
- Total dependent repositories: 1
- Total versions: 7
- Total maintainers: 1
cran.r-project.org: beginr
Functions for R Beginners
- Homepage: https://github.com/pzhaonet/beginr
- Documentation: http://cran.r-project.org/web/packages/beginr/beginr.pdf
- License: MIT + file LICENSE
- Status: removed
-
Latest release: 0.1.7
published about 7 years ago
Rankings
Maintainers (1)
Dependencies
- R >= 3.1.0 depends
- cranlogs >= 2.1.0 imports
- R >= 3.1.0 depends
- cli * imports
- crayon * imports
- dplyr * imports
- grDevices * imports
- magrittr * imports
- purrr * imports
- rstudioapi * imports
- tibble * imports
- tools * imports
- utils * imports