bulkAnalyseR
Science Score: 33.0%
This score indicates how likely this project is to be science-related based on various indicators:
-
○CITATION.cff file
-
○codemeta.json file
-
○.zenodo.json file
-
✓DOI references
Found 1 DOI reference(s) in README -
✓Academic publication links
Links to: biorxiv.org, sciencedirect.com -
✓Committers with academic emails
2 of 5 committers (40.0%) from academic institutions -
○Institutional organization owner
-
○JOSS paper metadata
-
○Scientific vocabulary similarity
Low similarity (13.2%) to scientific vocabulary
Last synced: 10 months ago
·
JSON representation
Repository
Basic Info
- Host: GitHub
- Owner: Core-Bioinformatics
- License: gpl-3.0
- Language: HTML
- Default Branch: main
- Homepage: https://core-bioinformatics.github.io/bulkAnalyseR/
- Size: 29.5 MB
Statistics
- Stars: 28
- Watchers: 2
- Forks: 3
- Open Issues: 1
- Releases: 3
Created about 5 years ago
· Last pushed over 2 years ago
Metadata Files
Readme
License
README.md
bulkAnalyseR: An accessible, interactive pipeline for analysing and sharing bulk sequencing results
Bulk sequencing experiments (e.g. mRNAseq, sRNAseq etc) are essential for exploring a wide range of biological questions. To bring the data analysis closer to its interpretation and facilitate both interactive, exploratory tasks and the sharing of (easily accessible) information, we present *bulkAnalyseR*, an R package that offers a seamless, customisable solution for most bulk sequencing datasets. By integrating state-of-the-art approaches without relying on extensive computational support, and replacing static images with interactive panels, our aim is to further support and strengthen the reusability of data. *bulkAnalyseR* enables standard analyses of bulk data, using an expression matrix as starting point. It presents the outputs of various steps in an interactive web-based interface, making it easy to generate, explore and verify hypotheses. Moreover, the app can be easily shared and published, incentivising research reproducibility and allowing others to explore the same processed data.
Preprint: https://www.biorxiv.org/content/10.1101/2021.12.23.473982v1
Live app example: https://bioinf.stemcells.cam.ac.uk/shiny/bulkAnalyseR/Yang2019/
If you are using components of this package in published research please cite the following papers along with the *bulkAnalyseR* manuscript:
* **Noise removal:** Moutsopoulos, I. et al. (2021). noisyR: enhancing biological signal in sequencing datasets by characterizing random technical noise. Nucleic Acids Research, 49(14),
e83–e83.
* **Differential expression:** Robinson, M. D. et al. (2009). edgeR: a Bioconductor package for differential expression analysis of digital gene expression data. Bioinformatics, 26(1), 139–140. and Love M.I., et al. Moderated estimation of fold change and dispersion for RNA-seq data with DESeq2. Genome Biol. 2014; 15:550.
* **Enrichment analysis:** Raudvere, U. et al. (2019). g:Profiler: a web server for functional enrichment analysis and conversions of gene lists (2019 update). Nucleic Acids Research, 47(W1), W191–W198.
* **Gene regulatory network inference:** Huynh-Thu, V. A. et al. (2010). Inferring regulatory networks from expression data using tree-based methods. PloS one, 5(9), e12776.
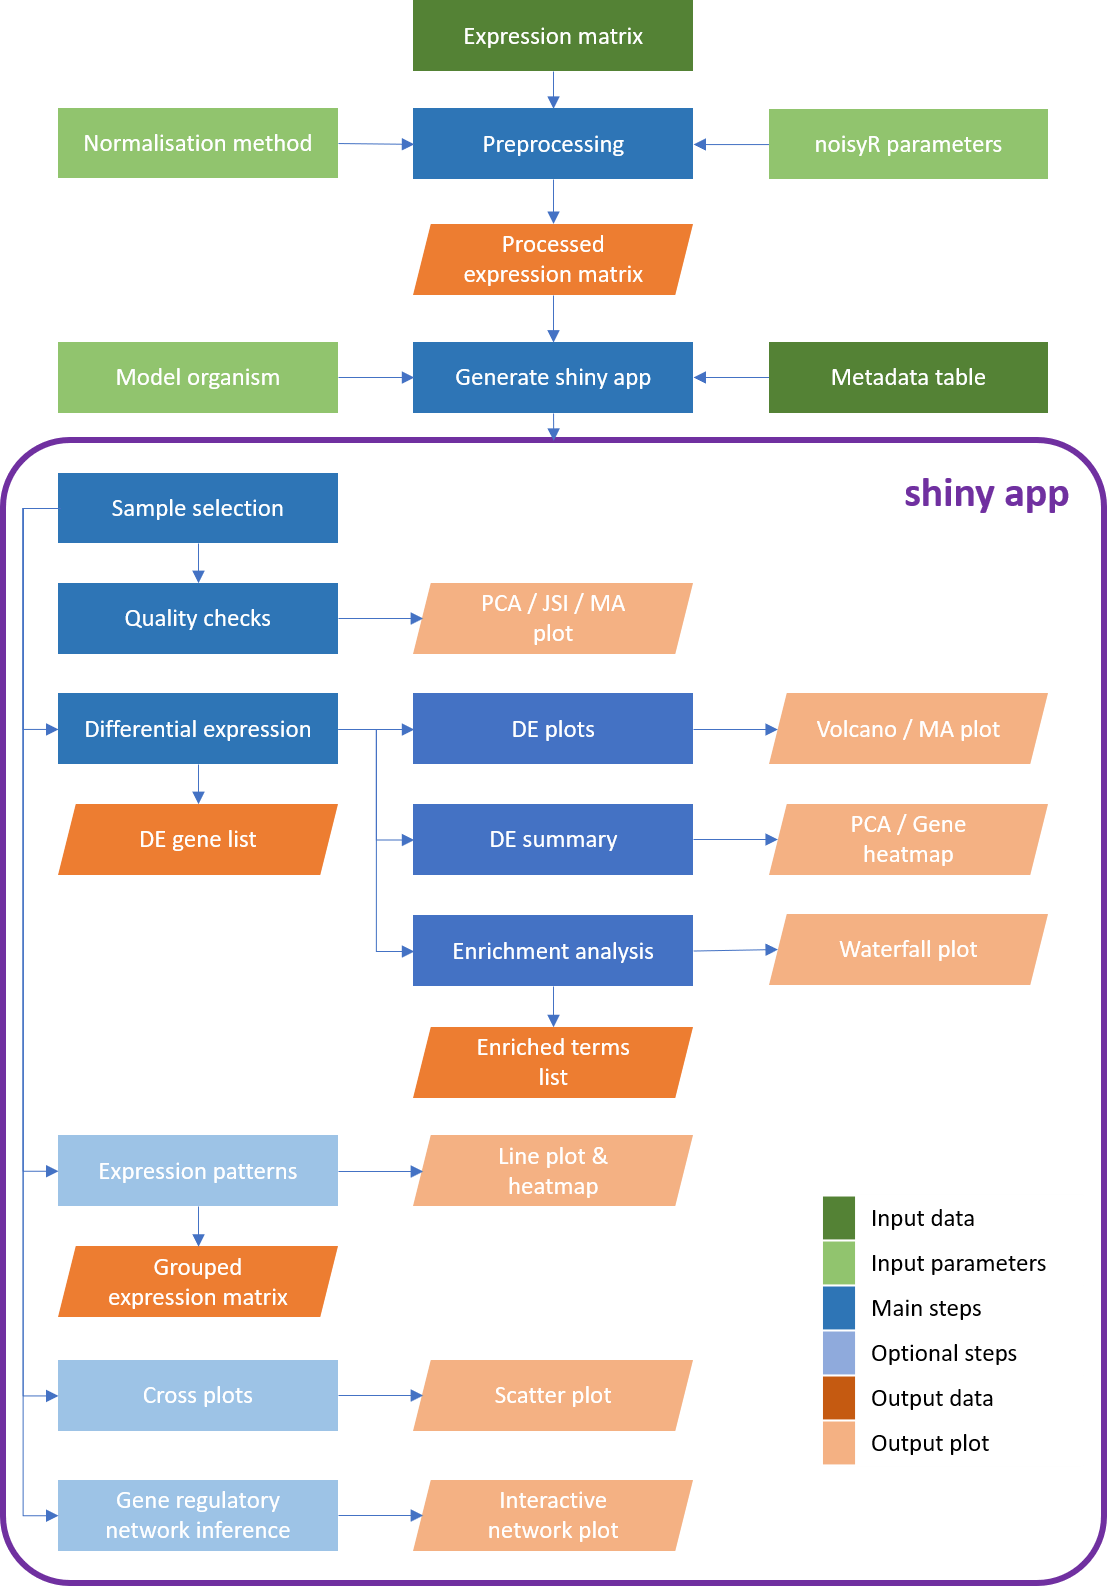 *Workflow diagram of the **bulkAnalyseR** pipeline. The input comprises a processed (i.e. normalised, noise-corrected) expression matrix. Using **bulkAnalyseR**, all standard steps related to differential expression analyses are handled seamlessley. The pairwaise comparison of differential expression outputs is also possible (using cross plots and upset plots). Finally, localised Gene Regulatory Networks can be created.*
## Preprocessing step
### Defining the input expression matrix and corresponding metadata
To create a shiny app using *bulkAnalyseR*, you need a processed (e.g. normalised, noise corrected) expression matrix and a corresponding metadata table loaded in your workspace.
The expression matrix is expected to have genes on the rows (with the Ensembl ID as the row name) and samples on the columns.
The first column of the metadata table must match the column names of the expression matrix. The other columns of the metadata table contain other information about the samples e.g. time points, treatment groups, demographic information etc; the differential expression analysis may take into account a subset of these columns.
We illustrate this on a case study from a 2019 paper by Yang et al (https://www.sciencedirect.com/science/article/pii/S2405471219301152). Using three time points, each with two replicates, for some bulk mRNAseq samples, we obtain the following matrices:
| |SRR7624365 | SRR7624366 | SRR7624371 | SRR7624372 | SRR7624375 | SRR7624376 |
|---|---|---|---|---|---|--- |
|ENSMUSG00000102693| 2 | 0 | 0 | 0 | 0 | 0 |
|ENSMUSG00000064842| 0 | 0 | 0 | 0 | 0 | 0 |
|ENSMUSG00000051951| 6 | 4 | 2 | 0 | 47 | 37 |
|| ... | ... | ... | ... | ... | ... |
Below is an example of a metadata table:
| srr | timepoint |
| --- | --- |
| SRR7624365 | 0h |
| SRR7624366 | 0h |
| SRR7624371 | 12h |
| SRR7624372 | 12h |
| SRR7624375 | 36h |
| SRR7624376 | 36h |
### Denoising and normalisation
Before using the expression matrix to create a shiny app, some preprocessing should be performed. *bulkAnalyseR* contains the function **preprocessExpressionMatrix** which takes the raw expression matrix as input, then denoises the data using [*noisyR*](https://github.com/Core-Bioinformatics/noisyR) and normalises the expression levels using either quantile (by default) or RPM normalisation (specified using *normalisation.method* parameter).
It is not recommended to use data which has not been denoised and normalised as input to *generateShinyApp*; noisy data is prone to spurious, un-reproducible patterns; analyses performed on unnormalised data are unlikely to be robust. You can also perform your own preprocessing outside *preprocessExpressionMatrix* function.
Main function: *preprocessExpressionMatrix()*
Supporting function: *noisyr_counts_with_plot()*
## Generating shiny app
The central function in *bulkAnalyseR* is **generateShinyApp**. This function creates an app.R file and all required objects to run the app in .rda format in the target directory. The key inputs to **generateShinyApp** are *expression.matrix* (after being processed using *preprocessExpressionMatrix*) and *meta*. You can also specify the title, a folder name where the app will be saved, a shiny theme, as well as specifying the organism on which your data was generated.
Calling *generateShinyApp* with these parameters will create a folder with your chosen name in which there will be 2 files *expression_matrix.rda* and *metadata.rda* and *app.R* which defines the app. To see the app, you can call *shiny::runApp()* with the name of the folder as parameter. The app generated is standalone and can be shared with collaborators or published online through a platform like [shinyapps.io](https://www.shinyapps.io/). This provides an easy way for anyone to explore the data and verify the conclusions, increasing access and promoting reproducibility of the bioinformatics analysis.
By default, the app will have 9 panels: Sample select, Quality checks, Differential expression, Volcano and MA plots, DE summary, Enrichment, Expression patterns, Cross plots, GRN inference. You can choose to remove one or more panels using the *default.panels* parameter.
By default, the app will look like this:
*Workflow diagram of the **bulkAnalyseR** pipeline. The input comprises a processed (i.e. normalised, noise-corrected) expression matrix. Using **bulkAnalyseR**, all standard steps related to differential expression analyses are handled seamlessley. The pairwaise comparison of differential expression outputs is also possible (using cross plots and upset plots). Finally, localised Gene Regulatory Networks can be created.*
## Preprocessing step
### Defining the input expression matrix and corresponding metadata
To create a shiny app using *bulkAnalyseR*, you need a processed (e.g. normalised, noise corrected) expression matrix and a corresponding metadata table loaded in your workspace.
The expression matrix is expected to have genes on the rows (with the Ensembl ID as the row name) and samples on the columns.
The first column of the metadata table must match the column names of the expression matrix. The other columns of the metadata table contain other information about the samples e.g. time points, treatment groups, demographic information etc; the differential expression analysis may take into account a subset of these columns.
We illustrate this on a case study from a 2019 paper by Yang et al (https://www.sciencedirect.com/science/article/pii/S2405471219301152). Using three time points, each with two replicates, for some bulk mRNAseq samples, we obtain the following matrices:
| |SRR7624365 | SRR7624366 | SRR7624371 | SRR7624372 | SRR7624375 | SRR7624376 |
|---|---|---|---|---|---|--- |
|ENSMUSG00000102693| 2 | 0 | 0 | 0 | 0 | 0 |
|ENSMUSG00000064842| 0 | 0 | 0 | 0 | 0 | 0 |
|ENSMUSG00000051951| 6 | 4 | 2 | 0 | 47 | 37 |
|| ... | ... | ... | ... | ... | ... |
Below is an example of a metadata table:
| srr | timepoint |
| --- | --- |
| SRR7624365 | 0h |
| SRR7624366 | 0h |
| SRR7624371 | 12h |
| SRR7624372 | 12h |
| SRR7624375 | 36h |
| SRR7624376 | 36h |
### Denoising and normalisation
Before using the expression matrix to create a shiny app, some preprocessing should be performed. *bulkAnalyseR* contains the function **preprocessExpressionMatrix** which takes the raw expression matrix as input, then denoises the data using [*noisyR*](https://github.com/Core-Bioinformatics/noisyR) and normalises the expression levels using either quantile (by default) or RPM normalisation (specified using *normalisation.method* parameter).
It is not recommended to use data which has not been denoised and normalised as input to *generateShinyApp*; noisy data is prone to spurious, un-reproducible patterns; analyses performed on unnormalised data are unlikely to be robust. You can also perform your own preprocessing outside *preprocessExpressionMatrix* function.
Main function: *preprocessExpressionMatrix()*
Supporting function: *noisyr_counts_with_plot()*
## Generating shiny app
The central function in *bulkAnalyseR* is **generateShinyApp**. This function creates an app.R file and all required objects to run the app in .rda format in the target directory. The key inputs to **generateShinyApp** are *expression.matrix* (after being processed using *preprocessExpressionMatrix*) and *meta*. You can also specify the title, a folder name where the app will be saved, a shiny theme, as well as specifying the organism on which your data was generated.
Calling *generateShinyApp* with these parameters will create a folder with your chosen name in which there will be 2 files *expression_matrix.rda* and *metadata.rda* and *app.R* which defines the app. To see the app, you can call *shiny::runApp()* with the name of the folder as parameter. The app generated is standalone and can be shared with collaborators or published online through a platform like [shinyapps.io](https://www.shinyapps.io/). This provides an easy way for anyone to explore the data and verify the conclusions, increasing access and promoting reproducibility of the bioinformatics analysis.
By default, the app will have 9 panels: Sample select, Quality checks, Differential expression, Volcano and MA plots, DE summary, Enrichment, Expression patterns, Cross plots, GRN inference. You can choose to remove one or more panels using the *default.panels* parameter.
By default, the app will look like this:
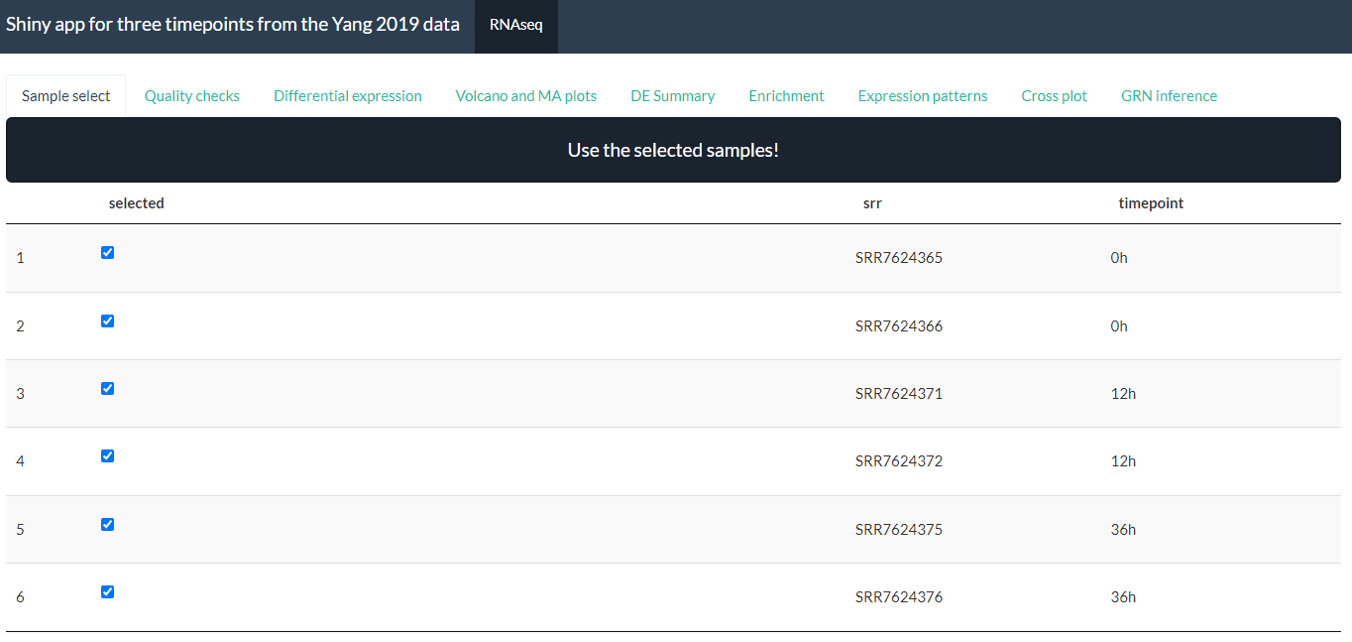 *Screenshot from Yang case study processed with the bulkAnalyseR app*
See [vignette](https://raw.githack.com/Core-Bioinformatics/bulkAnalyseR/main/vignettes/bulkAnalyseR.html) for more details on the individual panels.
You can also add custom extra panels and data using the *panels.extra* and *data.extra* parameters.
Main function: *generateShinyApp()*
Panel functions (with UI and server components): *sampleSelectPanel*, *QCpanel*, *DEpanel*, *DEplotPanel*, *DEsummaryPanel*, *enrichmentPanel*, *patternPanel*, *crossPanel*, *GRNpanel*
Supporting functions: *DEanalysis_deseq2*, *DEanalysis_edger*, *calculate_condition_mean_sd_per_gene*, *determine_uds*, *expression_heatmap*, *jaccard_heatmap*, *ma_enhance*, *ma_plot*, *make_heatmap_matrix*, *make_pattern_matrix*, *plot_line_pattern*, *plot_pca*, *volcano_enhance*, *volcano_plot*
## Quick Start Guide
A shiny app for the [Yang et al 2019 data](https://www.sciencedirect.com/science/article/pii/S2405471219301152) can be generated using the following code:
```{r}
library(bulkAnalyseR)
#load expression matrix
expression.matrix <- as.matrix(read.csv(
system.file("extdata", "expression_matrix.csv", package = "bulkAnalyseR"),
row.names = 1
))
#create metadata table
metadata <- data.frame(srr = colnames(expression.matrix),
timepoint = rep(c("0h", "12h", "36h"), each = 2))
#run preprocessing
expression.matrix.preproc <- preprocessExpressionMatrix(expression.matrix)
#create shiny app
shiny.dir <- "shiny_Yang2019"
generateShinyApp(
expression.matrix = expression.matrix.preproc,
metadata = metadata,
shiny.dir = shiny.dir,
app.title = "Shiny app for three timepoints from the Yang 2019 data",
organism = "mmusculus",
org.db = "org.Mm.eg.db"
)
#run shiny app
shiny::runApp(shiny.dir)
```
## Installation guide
*bulkAnalyseR* can be installed from CRAN using *install.packages("bulkAnalyseR")*. Please make sure all bioconductor dependencies are also installed.
To install the latest stable development version from GitHub, first install the CRAN dependencies as well as *devtools* then use *devtools::install_github("Core-Bioinformatics/bulkAnalyseR")*.
### Required CRAN packages (use *install.packages()*) ###
* utils
* stats
* grDevices
* tibble
* dplyr
* magrittr
* shiny
* shinythemes
* shinyWidgets
* shinyjqui
* shinyjs
* ggplot2
* ggrepel
* ggnewscale
* ggforce
* ggrastr
* RColorBrewer
* glue
* rlang
* noisyr
* matrixStats
* visNetwork
* gprofiler2
* circlize
* shinyLP
### Required Bioconductor packages (use *BiocManager::install()*) ###
* preprocessCore
* edgeR
* DESeq2
* AnnotationDBI
* GENIE3
* ComplexHeatmap
### Bioconductor annotation packages (the one for your model organism is required, human and mouse ones are listed here)
* org.Hs.eg.db
* org.Mm.eg.db
*Screenshot from Yang case study processed with the bulkAnalyseR app*
See [vignette](https://raw.githack.com/Core-Bioinformatics/bulkAnalyseR/main/vignettes/bulkAnalyseR.html) for more details on the individual panels.
You can also add custom extra panels and data using the *panels.extra* and *data.extra* parameters.
Main function: *generateShinyApp()*
Panel functions (with UI and server components): *sampleSelectPanel*, *QCpanel*, *DEpanel*, *DEplotPanel*, *DEsummaryPanel*, *enrichmentPanel*, *patternPanel*, *crossPanel*, *GRNpanel*
Supporting functions: *DEanalysis_deseq2*, *DEanalysis_edger*, *calculate_condition_mean_sd_per_gene*, *determine_uds*, *expression_heatmap*, *jaccard_heatmap*, *ma_enhance*, *ma_plot*, *make_heatmap_matrix*, *make_pattern_matrix*, *plot_line_pattern*, *plot_pca*, *volcano_enhance*, *volcano_plot*
## Quick Start Guide
A shiny app for the [Yang et al 2019 data](https://www.sciencedirect.com/science/article/pii/S2405471219301152) can be generated using the following code:
```{r}
library(bulkAnalyseR)
#load expression matrix
expression.matrix <- as.matrix(read.csv(
system.file("extdata", "expression_matrix.csv", package = "bulkAnalyseR"),
row.names = 1
))
#create metadata table
metadata <- data.frame(srr = colnames(expression.matrix),
timepoint = rep(c("0h", "12h", "36h"), each = 2))
#run preprocessing
expression.matrix.preproc <- preprocessExpressionMatrix(expression.matrix)
#create shiny app
shiny.dir <- "shiny_Yang2019"
generateShinyApp(
expression.matrix = expression.matrix.preproc,
metadata = metadata,
shiny.dir = shiny.dir,
app.title = "Shiny app for three timepoints from the Yang 2019 data",
organism = "mmusculus",
org.db = "org.Mm.eg.db"
)
#run shiny app
shiny::runApp(shiny.dir)
```
## Installation guide
*bulkAnalyseR* can be installed from CRAN using *install.packages("bulkAnalyseR")*. Please make sure all bioconductor dependencies are also installed.
To install the latest stable development version from GitHub, first install the CRAN dependencies as well as *devtools* then use *devtools::install_github("Core-Bioinformatics/bulkAnalyseR")*.
### Required CRAN packages (use *install.packages()*) ###
* utils
* stats
* grDevices
* tibble
* dplyr
* magrittr
* shiny
* shinythemes
* shinyWidgets
* shinyjqui
* shinyjs
* ggplot2
* ggrepel
* ggnewscale
* ggforce
* ggrastr
* RColorBrewer
* glue
* rlang
* noisyr
* matrixStats
* visNetwork
* gprofiler2
* circlize
* shinyLP
### Required Bioconductor packages (use *BiocManager::install()*) ###
* preprocessCore
* edgeR
* DESeq2
* AnnotationDBI
* GENIE3
* ComplexHeatmap
### Bioconductor annotation packages (the one for your model organism is required, human and mouse ones are listed here)
* org.Hs.eg.db
* org.Mm.eg.db
*Workflow diagram of the **bulkAnalyseR** pipeline. The input comprises a processed (i.e. normalised, noise-corrected) expression matrix. Using **bulkAnalyseR**, all standard steps related to differential expression analyses are handled seamlessley. The pairwaise comparison of differential expression outputs is also possible (using cross plots and upset plots). Finally, localised Gene Regulatory Networks can be created.*
## Preprocessing step
### Defining the input expression matrix and corresponding metadata
To create a shiny app using *bulkAnalyseR*, you need a processed (e.g. normalised, noise corrected) expression matrix and a corresponding metadata table loaded in your workspace.
The expression matrix is expected to have genes on the rows (with the Ensembl ID as the row name) and samples on the columns.
The first column of the metadata table must match the column names of the expression matrix. The other columns of the metadata table contain other information about the samples e.g. time points, treatment groups, demographic information etc; the differential expression analysis may take into account a subset of these columns.
We illustrate this on a case study from a 2019 paper by Yang et al (https://www.sciencedirect.com/science/article/pii/S2405471219301152). Using three time points, each with two replicates, for some bulk mRNAseq samples, we obtain the following matrices:
| |SRR7624365 | SRR7624366 | SRR7624371 | SRR7624372 | SRR7624375 | SRR7624376 |
|---|---|---|---|---|---|--- |
|ENSMUSG00000102693| 2 | 0 | 0 | 0 | 0 | 0 |
|ENSMUSG00000064842| 0 | 0 | 0 | 0 | 0 | 0 |
|ENSMUSG00000051951| 6 | 4 | 2 | 0 | 47 | 37 |
|| ... | ... | ... | ... | ... | ... |
Below is an example of a metadata table:
| srr | timepoint |
| --- | --- |
| SRR7624365 | 0h |
| SRR7624366 | 0h |
| SRR7624371 | 12h |
| SRR7624372 | 12h |
| SRR7624375 | 36h |
| SRR7624376 | 36h |
### Denoising and normalisation
Before using the expression matrix to create a shiny app, some preprocessing should be performed. *bulkAnalyseR* contains the function **preprocessExpressionMatrix** which takes the raw expression matrix as input, then denoises the data using [*noisyR*](https://github.com/Core-Bioinformatics/noisyR) and normalises the expression levels using either quantile (by default) or RPM normalisation (specified using *normalisation.method* parameter).
It is not recommended to use data which has not been denoised and normalised as input to *generateShinyApp*; noisy data is prone to spurious, un-reproducible patterns; analyses performed on unnormalised data are unlikely to be robust. You can also perform your own preprocessing outside *preprocessExpressionMatrix* function.
Main function: *preprocessExpressionMatrix()*
Supporting function: *noisyr_counts_with_plot()*
## Generating shiny app
The central function in *bulkAnalyseR* is **generateShinyApp**. This function creates an app.R file and all required objects to run the app in .rda format in the target directory. The key inputs to **generateShinyApp** are *expression.matrix* (after being processed using *preprocessExpressionMatrix*) and *meta*. You can also specify the title, a folder name where the app will be saved, a shiny theme, as well as specifying the organism on which your data was generated.
Calling *generateShinyApp* with these parameters will create a folder with your chosen name in which there will be 2 files *expression_matrix.rda* and *metadata.rda* and *app.R* which defines the app. To see the app, you can call *shiny::runApp()* with the name of the folder as parameter. The app generated is standalone and can be shared with collaborators or published online through a platform like [shinyapps.io](https://www.shinyapps.io/). This provides an easy way for anyone to explore the data and verify the conclusions, increasing access and promoting reproducibility of the bioinformatics analysis.
By default, the app will have 9 panels: Sample select, Quality checks, Differential expression, Volcano and MA plots, DE summary, Enrichment, Expression patterns, Cross plots, GRN inference. You can choose to remove one or more panels using the *default.panels* parameter.
By default, the app will look like this:
*Screenshot from Yang case study processed with the bulkAnalyseR app*
See [vignette](https://raw.githack.com/Core-Bioinformatics/bulkAnalyseR/main/vignettes/bulkAnalyseR.html) for more details on the individual panels.
You can also add custom extra panels and data using the *panels.extra* and *data.extra* parameters.
Main function: *generateShinyApp()*
Panel functions (with UI and server components): *sampleSelectPanel*, *QCpanel*, *DEpanel*, *DEplotPanel*, *DEsummaryPanel*, *enrichmentPanel*, *patternPanel*, *crossPanel*, *GRNpanel*
Supporting functions: *DEanalysis_deseq2*, *DEanalysis_edger*, *calculate_condition_mean_sd_per_gene*, *determine_uds*, *expression_heatmap*, *jaccard_heatmap*, *ma_enhance*, *ma_plot*, *make_heatmap_matrix*, *make_pattern_matrix*, *plot_line_pattern*, *plot_pca*, *volcano_enhance*, *volcano_plot*
## Quick Start Guide
A shiny app for the [Yang et al 2019 data](https://www.sciencedirect.com/science/article/pii/S2405471219301152) can be generated using the following code:
```{r}
library(bulkAnalyseR)
#load expression matrix
expression.matrix <- as.matrix(read.csv(
system.file("extdata", "expression_matrix.csv", package = "bulkAnalyseR"),
row.names = 1
))
#create metadata table
metadata <- data.frame(srr = colnames(expression.matrix),
timepoint = rep(c("0h", "12h", "36h"), each = 2))
#run preprocessing
expression.matrix.preproc <- preprocessExpressionMatrix(expression.matrix)
#create shiny app
shiny.dir <- "shiny_Yang2019"
generateShinyApp(
expression.matrix = expression.matrix.preproc,
metadata = metadata,
shiny.dir = shiny.dir,
app.title = "Shiny app for three timepoints from the Yang 2019 data",
organism = "mmusculus",
org.db = "org.Mm.eg.db"
)
#run shiny app
shiny::runApp(shiny.dir)
```
## Installation guide
*bulkAnalyseR* can be installed from CRAN using *install.packages("bulkAnalyseR")*. Please make sure all bioconductor dependencies are also installed.
To install the latest stable development version from GitHub, first install the CRAN dependencies as well as *devtools* then use *devtools::install_github("Core-Bioinformatics/bulkAnalyseR")*.
### Required CRAN packages (use *install.packages()*) ###
* utils
* stats
* grDevices
* tibble
* dplyr
* magrittr
* shiny
* shinythemes
* shinyWidgets
* shinyjqui
* shinyjs
* ggplot2
* ggrepel
* ggnewscale
* ggforce
* ggrastr
* RColorBrewer
* glue
* rlang
* noisyr
* matrixStats
* visNetwork
* gprofiler2
* circlize
* shinyLP
### Required Bioconductor packages (use *BiocManager::install()*) ###
* preprocessCore
* edgeR
* DESeq2
* AnnotationDBI
* GENIE3
* ComplexHeatmap
### Bioconductor annotation packages (the one for your model organism is required, human and mouse ones are listed here)
* org.Hs.eg.db
* org.Mm.eg.db
Owner
- Name: Cambridge Stem Cell Institute Core Bioinformatics group
- Login: Core-Bioinformatics
- Kind: organization
- Website: https://www.corebioinf.stemcells.cam.ac.uk/
- Repositories: 4
- Profile: https://github.com/Core-Bioinformatics
GitHub Events
Total
- Issues event: 2
- Watch event: 2
- Issue comment event: 1
Last Year
- Issues event: 2
- Watch event: 2
- Issue comment event: 1
Committers
Last synced: over 2 years ago
Top Committers
| Name | Commits | |
|---|---|---|
| Ilias Moutsopoulos | e****s@h****m | 162 |
| elliecwilliams | e****3@c****k | 47 |
| I. Moutsopoulos | i****3@c****k | 9 |
| elliecwilliams | 3****s | 3 |
| Irina Mohorianu | i****u@g****m | 2 |
Committer Domains (Top 20 + Academic)
cam.ac.uk: 2
Issues and Pull Requests
Last synced: 11 months ago
All Time
- Total issues: 3
- Total pull requests: 27
- Average time to close issues: 4 months
- Average time to close pull requests: 2 days
- Total issue authors: 3
- Total pull request authors: 2
- Average comments per issue: 1.0
- Average comments per pull request: 0.0
- Merged pull requests: 26
- Bot issues: 0
- Bot pull requests: 0
Past Year
- Issues: 2
- Pull requests: 0
- Average time to close issues: 4 months
- Average time to close pull requests: N/A
- Issue authors: 2
- Pull request authors: 0
- Average comments per issue: 0.5
- Average comments per pull request: 0
- Merged pull requests: 0
- Bot issues: 0
- Bot pull requests: 0
Top Authors
Issue Authors
- shaniAmare (1)
- kmcandre88 (1)
- AV973 (1)
Pull Request Authors
- emouts (20)
- elliecwilliams (7)
Top Labels
Issue Labels
Pull Request Labels
Packages
- Total packages: 1
-
Total downloads:
- cran 268 last-month
- Total dependent packages: 0
- Total dependent repositories: 0
- Total versions: 3
- Total maintainers: 1
cran.r-project.org: bulkAnalyseR
Interactive Shiny App for Bulk Sequencing Data
- Homepage: https://github.com/Core-Bioinformatics/bulkAnalyseR
- Documentation: http://cran.r-project.org/web/packages/bulkAnalyseR/bulkAnalyseR.pdf
- License: GPL-2
-
Latest release: 1.1.0
published over 3 years ago
Rankings
Forks count: 12.8%
Stargazers count: 13.3%
Average: 27.2%
Dependent packages count: 29.8%
Dependent repos count: 35.5%
Downloads: 44.7%
Maintainers (1)
Last synced:
11 months ago
Dependencies
DESCRIPTION
cran
- R >= 4.0 depends
- ComplexHeatmap * imports
- DESeq2 * imports
- DT * imports
- GENIE3 * imports
- RColorBrewer * imports
- UpSetR * imports
- circlize * imports
- dplyr * imports
- edgeR * imports
- ggforce * imports
- ggnewscale * imports
- ggplot2 * imports
- ggrastr * imports
- ggrepel * imports
- glue * imports
- gprofiler2 * imports
- grid * imports
- magrittr * imports
- matrixStats * imports
- noisyr * imports
- preprocessCore * imports
- rlang * imports
- scales * imports
- shiny * imports
- shinyLP * imports
- shinyWidgets * imports
- shinyjqui * imports
- shinyjs * imports
- stats * imports
- stringr * imports
- tibble * imports
- tidyr * imports
- utils * imports
- visNetwork * imports
- AnnotationDbi * suggests
- BiocManager * suggests
- knitr * suggests
- org.Hs.eg.db * suggests
- org.Mm.eg.db * suggests
- readxl * suggests
- rmarkdown * suggests
- shinythemes * suggests
- testthat >= 3.0.0 suggests