eAnalytics
Dynamic Web-based Analytics for the Energy Industry
Science Score: 26.0%
This score indicates how likely this project is to be science-related based on various indicators:
-
○CITATION.cff file
-
✓codemeta.json file
Found codemeta.json file -
○.zenodo.json file
-
✓DOI references
Found 5 DOI reference(s) in README -
○Academic publication links
-
○Committers with academic emails
-
○Institutional organization owner
-
○JOSS paper metadata
-
○Scientific vocabulary similarity
Low similarity (16.6%) to scientific vocabulary
Keywords
Repository
Dynamic Web-based Analytics for the Energy Industry
Basic Info
- Host: GitHub
- Owner: paulgovan
- License: apache-2.0
- Language: R
- Default Branch: master
- Homepage: http://paulgovan.github.io/eAnalytics/
- Size: 64.4 MB
Statistics
- Stars: 33
- Watchers: 6
- Forks: 25
- Open Issues: 0
- Releases: 6
Topics
Metadata Files
README.md

![]() <!-- badges: end -->
<!-- badges: end -->
eAnalytics

Features
- Profile: take an overview of the industry
- Performance: measure key performance indicators (KPIs)
- Trends: identify changes in the industry over time
- Explorer: discover new relationships in the data
Overview
eAnalytics is a Shiny web application built on top of R for energy analytics. To learn more about this project, check out this article.
Getting Started
To install eAnalytics in R:
S
install.packages("eAnalytics")
Or to install the latest developmental version:
S
devtools::install_github('paulgovan/eAnalytics')
To launch the app:
S
eAnalytics::eAnalytics()
Or to access the app through a browser, visit paulgovan.shinyapps.io/eAnalytics.
Data
eAnalytics is built around the energyr R package of data published by the United States Federal Energy Regulatory Commission www.ferc.gov. energyr contains several datasets for different industry segments:
electric: Electric Company Financial Datagas: Natural Gas Company Financial Datahydropower: Hydropower Plant Datalng: LNG Plant Dataoil: Oil Company Financial Datapipeline: Natural Gas Pipeline Project Datastorage: Natural Gas Storage Field Data
Tutorial
Home
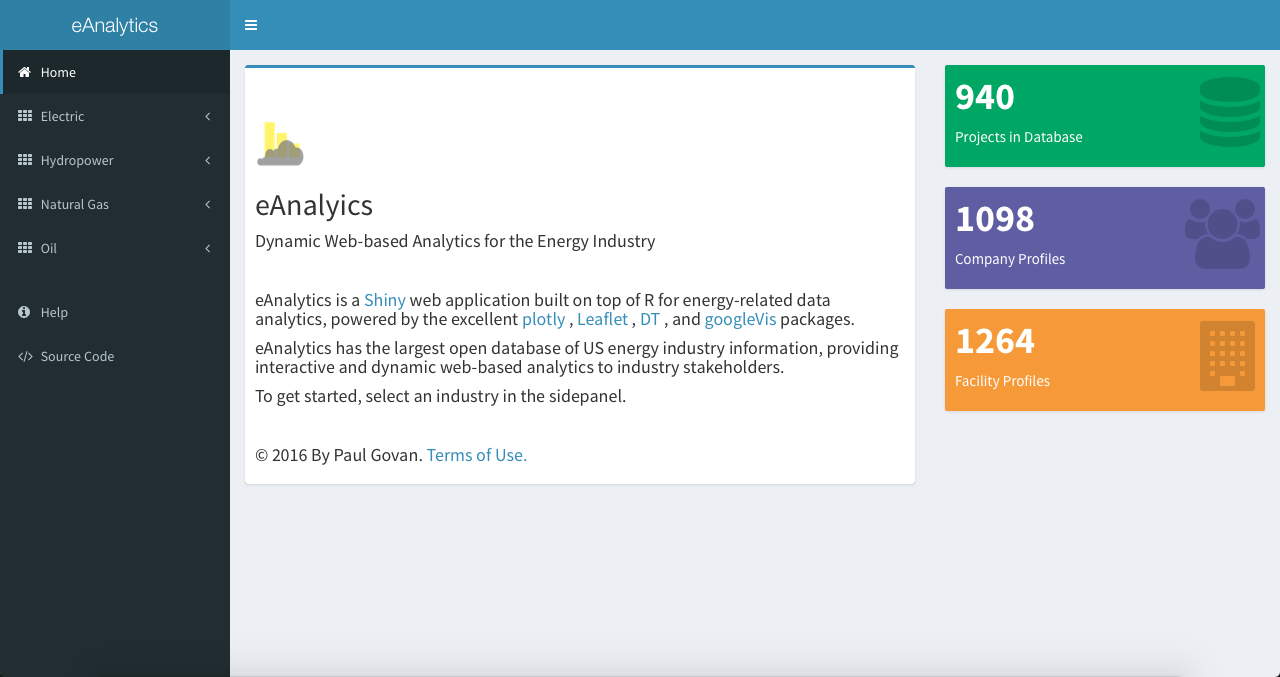
Launching the app first brings up the Home tab, which is basically a landing page that gives a brief introduction to the app and includes three value boxes for the current number of projects, companies, and facilities in the database.
Profile
The Profile tab contains a number of interactive maps with information about facilities for the selected industry. The figure below shows the Profile tab for the Natural Gas Industry.
Multiple options are currently available for customizing the maps. Choose a preferred size or color variable in the movable well panel, select from different basemaps via the lower-right control, and click on a specific facility to view additional information.

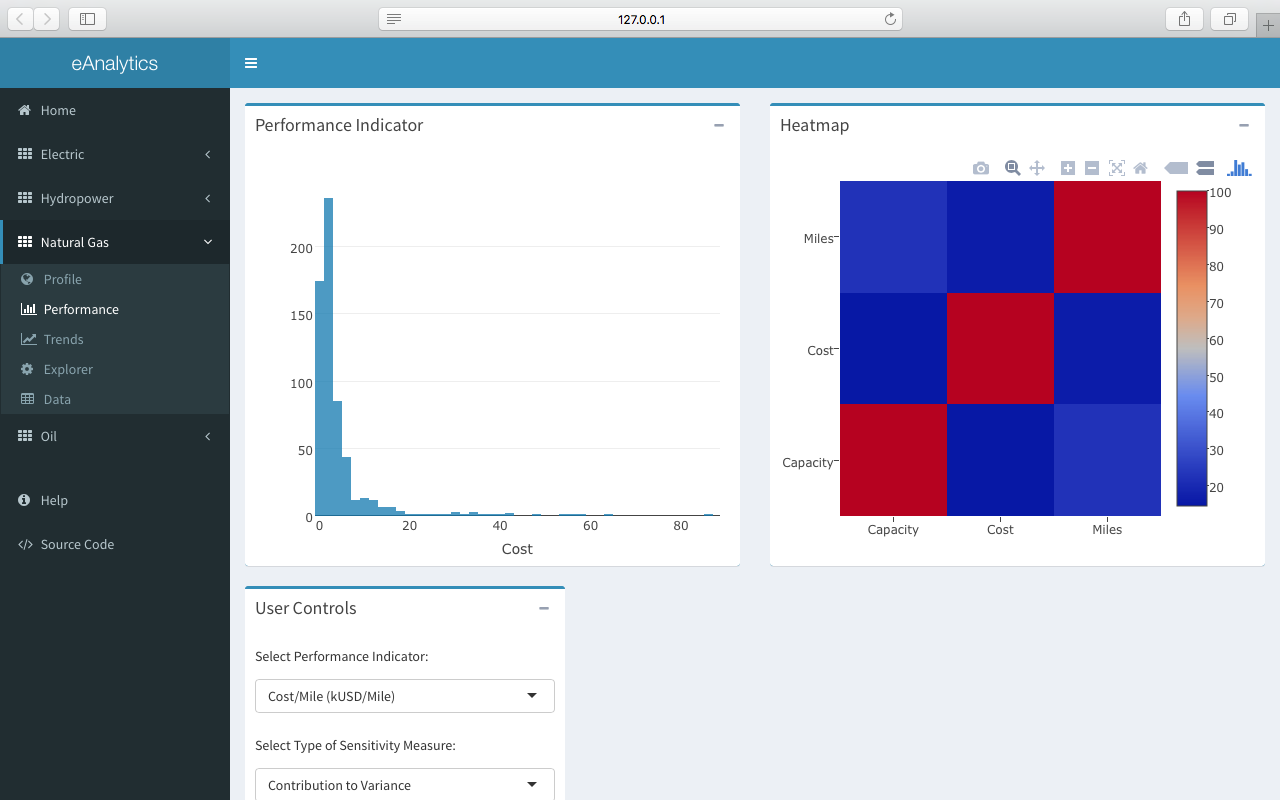
Performance
The Performance tab tracks a number of Key Performance Indicators (KPIs) for the selected industry. The following figure shows the Performance tab for the Natural Gas Industry.
Trends
The Trends tab contains multiple interactive time-series charts of financial information for the selected industry. The following figure shows the Performance tab for the Electric industry.
The time-series chart in the Trends tab is linked to the data table shown in the Data tab. Searching, filtering, and sorting the data in the data table will automatically update the time-series chart with the selected data.

Data
The Data tab contains interactive datatables of information for the selected industry. The data can be searched, filtered, and sorted as required. The selected data can then be copied to the clipboard, downloaded to a csv or pdf file, or sent to a local printer. The figure below shows the Data tab for the Hydropower industry.

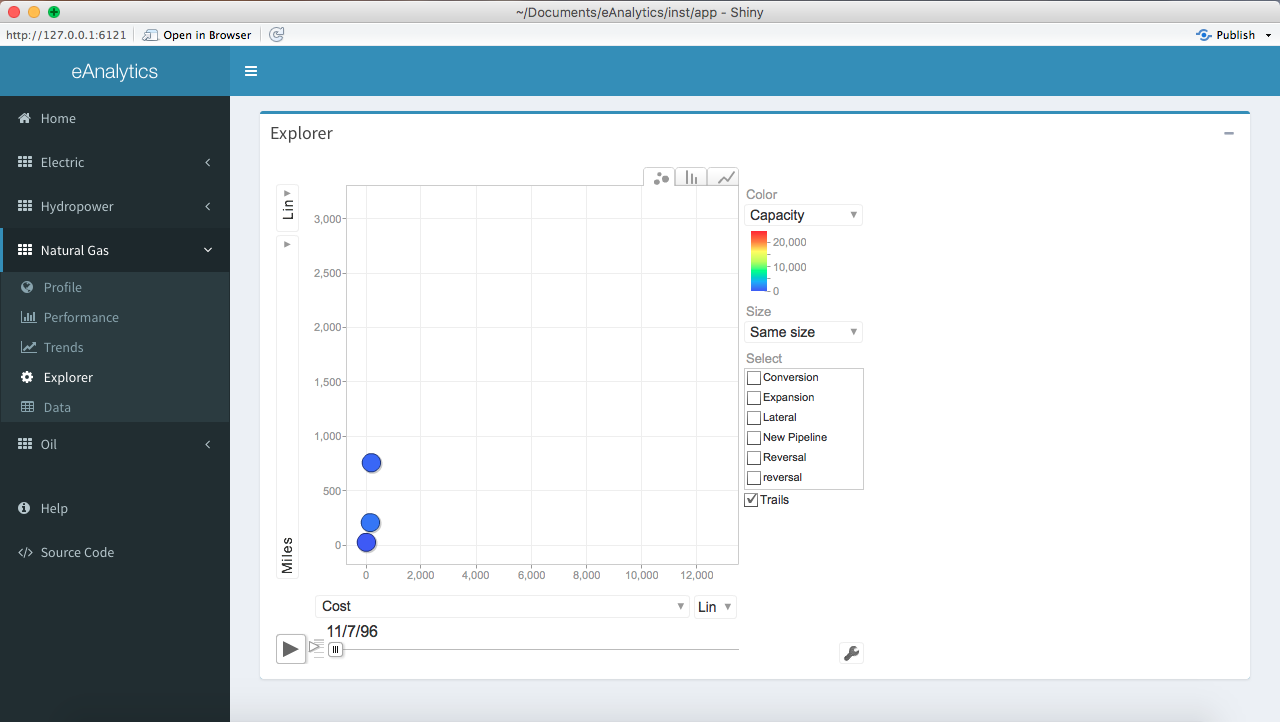
Explorer
The Explorer tab contains a dynamic motion chart for exploring several indicators over time. The following figure shows the Explorer tab for the Natural Gas Industry.
Code of Conduct
Please note that the eAnalytics project is released with a Contributor Code of Conduct. By contributing to this project, you agree to abide by its terms.
Owner
- Name: Paul Govan
- Login: paulgovan
- Kind: user
- Location: Greenville, SC
- Company: GE Renewable Energy
- Website: https://www.linkedin.com/in/paulgovan
- Repositories: 27
- Profile: https://github.com/paulgovan
Technical Leader | Reliability and Data Analytics | Renewable Energy
GitHub Events
Total
Last Year
Committers
Last synced: over 2 years ago
Top Committers
| Name | Commits | |
|---|---|---|
| Paul Govan | p****1@a****m | 131 |
| root | r****t@i****l | 1 |
Committer Domains (Top 20 + Academic)
Issues and Pull Requests
Last synced: 11 months ago
All Time
- Total issues: 4
- Total pull requests: 1
- Average time to close issues: almost 2 years
- Average time to close pull requests: less than a minute
- Total issue authors: 3
- Total pull request authors: 1
- Average comments per issue: 0.75
- Average comments per pull request: 0.0
- Merged pull requests: 1
- Bot issues: 0
- Bot pull requests: 0
Past Year
- Issues: 1
- Pull requests: 1
- Average time to close issues: 2 days
- Average time to close pull requests: less than a minute
- Issue authors: 1
- Pull request authors: 1
- Average comments per issue: 0.0
- Average comments per pull request: 0.0
- Merged pull requests: 1
- Bot issues: 0
- Bot pull requests: 0
Top Authors
Issue Authors
- paulgovan (2)
- Raghu-Akkihalli (1)
- JBeam4ME (1)
Pull Request Authors
- paulgovan (2)
Top Labels
Issue Labels
Pull Request Labels
Packages
- Total packages: 1
-
Total downloads:
- cran 264 last-month
- Total dependent packages: 0
- Total dependent repositories: 0
- Total versions: 7
- Total maintainers: 1
cran.r-project.org: eAnalytics
Dynamic Web-Based Analytics for the Energy Industry
- Homepage: http://paulgovan.github.io/eAnalytics/
- Documentation: http://cran.r-project.org/web/packages/eAnalytics/eAnalytics.pdf
- License: Apache License version 1.1 | Apache License version 2.0 [expanded from: Apache License]
-
Latest release: 0.3.1
published almost 2 years ago
Rankings
Maintainers (1)
Dependencies
- R >= 2.10.0 depends
- DT * imports
- dplyr * imports
- energyr * imports
- googleVis * imports
- leaflet * imports
- plotly >= 4.5.2 imports
- shiny * imports
- shinyWidgets * imports
- shinydashboard * imports
- shinytest * imports
- knitr * suggests
- rmarkdown * suggests
- JamesIves/github-pages-deploy-action v4.4.1 composite
- actions/checkout v3 composite
- r-lib/actions/setup-pandoc v2 composite
- r-lib/actions/setup-r v2 composite
- r-lib/actions/setup-r-dependencies v2 composite