cheem
Radial tours of local explanations. Package repository for trees of cheem work and app.
Science Score: 26.0%
This score indicates how likely this project is to be science-related based on various indicators:
-
○CITATION.cff file
-
✓codemeta.json file
Found codemeta.json file -
✓.zenodo.json file
Found .zenodo.json file -
○DOI references
-
○Academic publication links
-
○Committers with academic emails
-
○Institutional organization owner
-
○JOSS paper metadata
-
○Scientific vocabulary similarity
Low similarity (11.7%) to scientific vocabulary
Repository
Radial tours of local explanations. Package repository for trees of cheem work and app.
Basic Info
- Host: GitHub
- Owner: nspyrison
- License: other
- Language: R
- Default Branch: main
- Homepage: https://nspyrison.github.io/cheem/
- Size: 62.8 MB
Statistics
- Stars: 2
- Watchers: 3
- Forks: 2
- Open Issues: 0
- Releases: 1
Metadata Files
README.md
cheem
Interactively explore data- and local explanation- spaces and residual side-by-side. Further explore the support of a selected observation's local explanation with the radial tour.
Context
Local explanations approximate the linear variable importance of a non-linear model in the vicinity of one instance(observation). That is, a point-measure of each variable's importance to the model at the particular location in data-space.
cheem extracts the local explanation of every observation in a dataset, given a model. Given a model, extract the local explanation of every observation in a data set. View the data- and explanation-spaces side-by-side in an interactive shiny application. Further explored a selected point against a comparison using its explanation as a 1D projection basis. A radial tour then explores the structure of explanation projection.
Getting started
```
Download the package
install.packages("cheem", dependencies = TRUE)
May need to restart the R session so RSudio has the correct file structure
rstudioapi::restartSession()
Load cheem into session
library(cheem)
Try the app
run_app()
Processing your data; follow the examples in cheem_ls()
?cheem_ls ```
Global view
The global view shows data-, attribution-spaces, and residual plot side-by-side with linked brushing and hover tooltip.
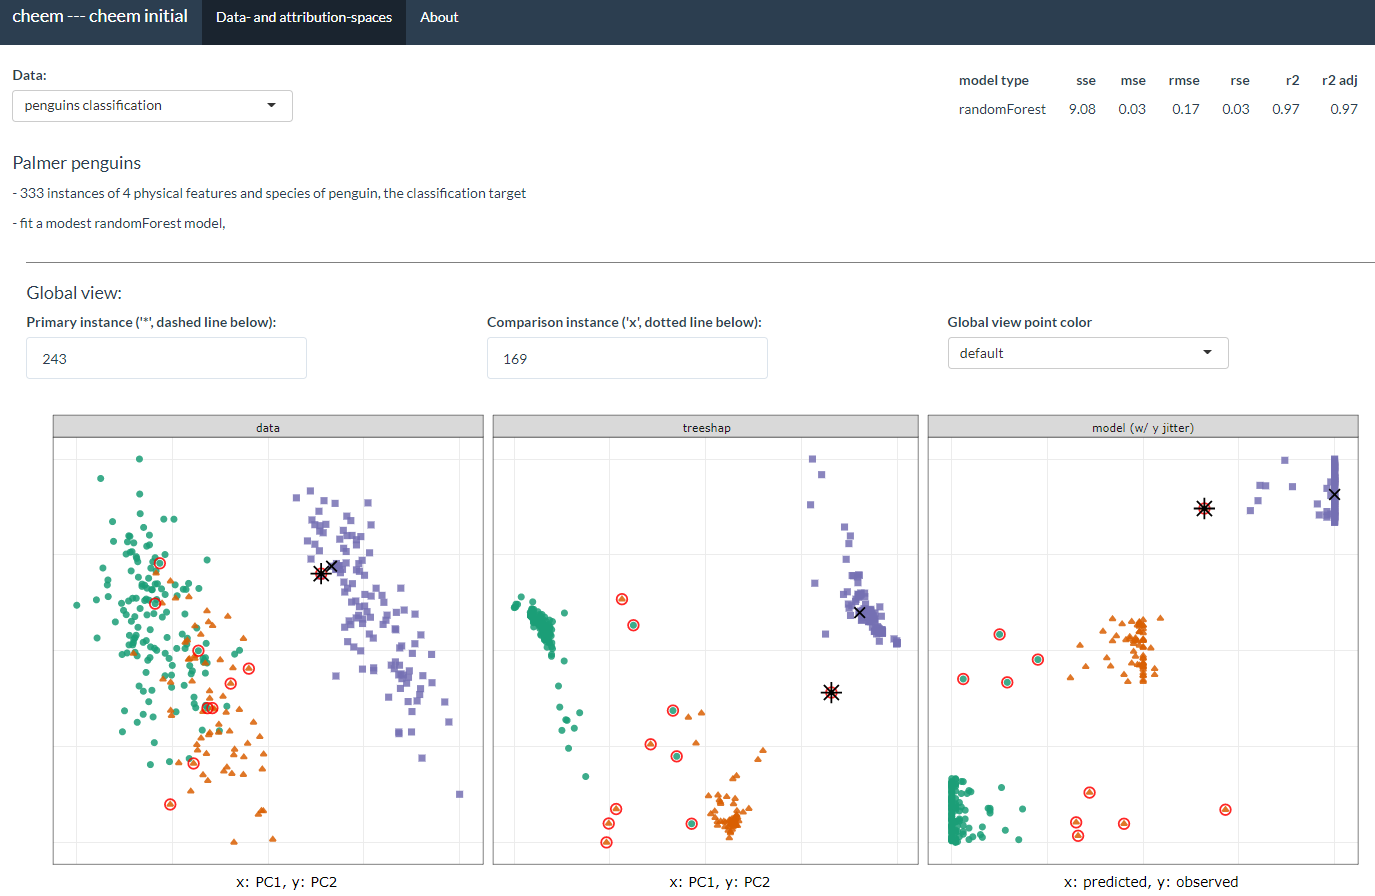
By exploring the global view, identify a primary and comparison observation to compare. For the classification task, typically a misclassified point is selected and compared against a nearby correctly classified one. In regression, we can compare a point with an extreme residual with a nearby point that is more accurately predicted.
Radial cheem tour
The attribution of the primary observation becomes the 1D basis for the tour. The variable with the largest difference between the primary and comparison point's bases is selected as the manipulation variable. That is the variable whose contribution change drives the change in the projection basis.
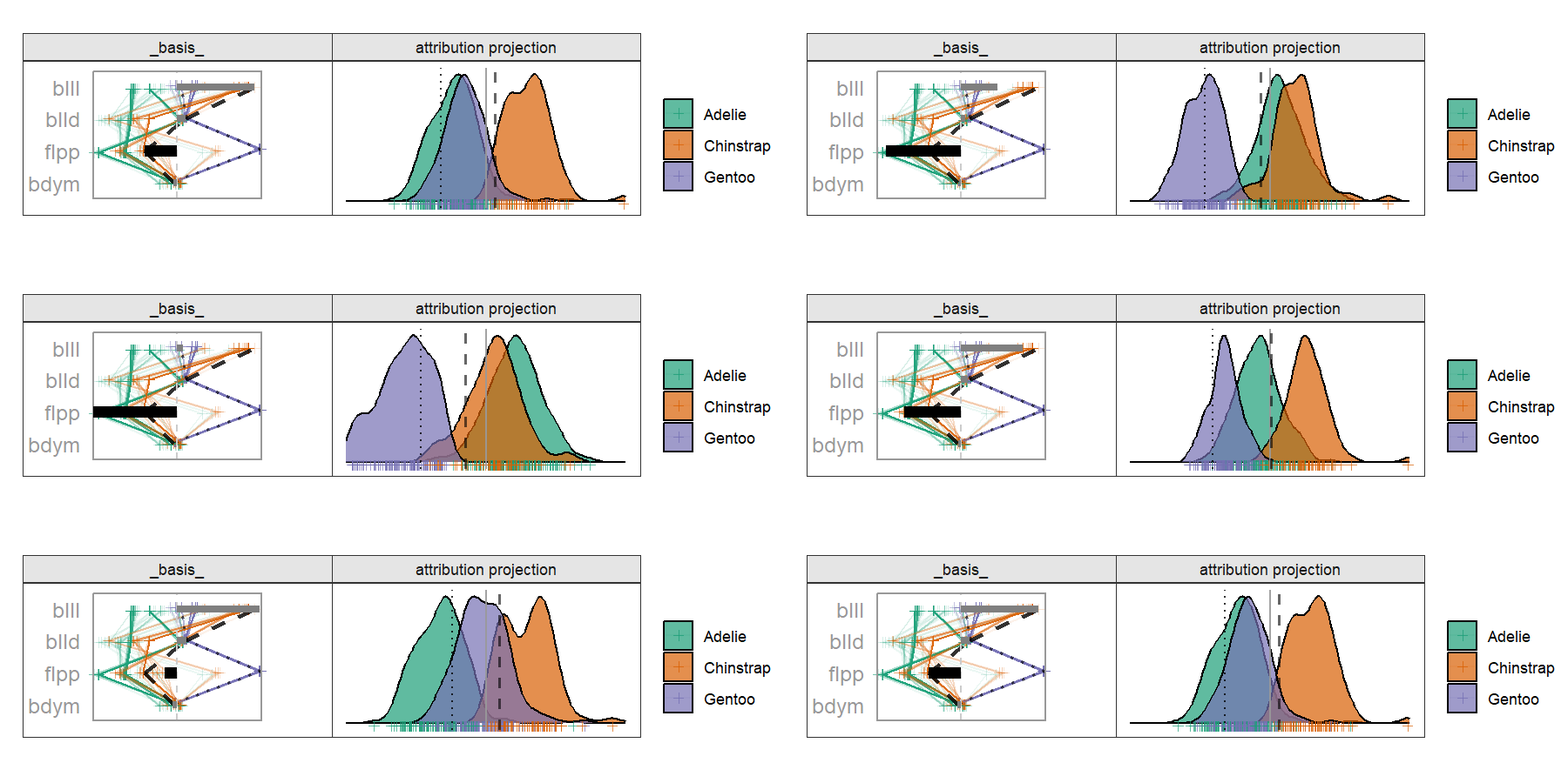
By doing this, we are testing the local explanation. By testing the variable sensitivity to the structure identified in the local explanation, we can better evaluate how good of an explanation it is; how sensitive its prediction is to a change in the variable contributions.
Original application
We started by looking at the model-agnostic local explanation tree SHAP applied to random forests. We made this choice out of concern for runtime (treeshap uses an alternative algorithm with reduced computational complexity and thus achieves much faster run time extracting the full SHAP matrix during the preprocessing step). The namesake, Cheem, stems from the original application to tree-based models in the DALEX ecosystem; Cheem are a fictional race of tree-based humanoids for consistency with the Dr. who/Dr. why theme.
Sources
Package build workflow
- devtools::document() ## documentation changes
- pkgdown::build_site() ## packagedown site changes (documentation, vignettes, readme)
- message("Manually do: Build tab > Install and Restart") ## build package
- rhub::checkforcran() ## check package
- devtools::submit_cran() ## Submit to CRAN
Owner
- Name: Nicholas Spyrison
- Login: nspyrison
- Kind: user
- Location: Mebourne, VIC, Australia
- Website: https://nspyrison.netlify.com/
- Twitter: nspyrison
- Repositories: 5
- Profile: https://github.com/nspyrison
Multivariate data vis, Machine Learning, and interpretability.
GitHub Events
Total
- Issues event: 1
- Issue comment event: 3
- Push event: 5
- Create event: 1
Last Year
- Issues event: 1
- Issue comment event: 3
- Push event: 5
- Create event: 1
Committers
Last synced: over 2 years ago
Top Committers
| Name | Commits | |
|---|---|---|
| Nick Spyrison | s****n@g****m | 188 |
| dicook | v****t@g****m | 7 |
Issues and Pull Requests
Last synced: 11 months ago
All Time
- Total issues: 4
- Total pull requests: 0
- Average time to close issues: 3 months
- Average time to close pull requests: N/A
- Total issue authors: 4
- Total pull request authors: 0
- Average comments per issue: 1.5
- Average comments per pull request: 0
- Merged pull requests: 0
- Bot issues: 0
- Bot pull requests: 0
Past Year
- Issues: 1
- Pull requests: 0
- Average time to close issues: N/A
- Average time to close pull requests: N/A
- Issue authors: 1
- Pull request authors: 0
- Average comments per issue: 0.0
- Average comments per pull request: 0
- Merged pull requests: 0
- Bot issues: 0
- Bot pull requests: 0
Top Authors
Issue Authors
- teunbrand (1)
- pbiecek (1)
- jameslamb (1)
- dicook (1)
Pull Request Authors
Top Labels
Issue Labels
Pull Request Labels
Packages
- Total packages: 1
-
Total downloads:
- cran 293 last-month
- Total dependent packages: 0
- Total dependent repositories: 0
- Total versions: 4
- Total maintainers: 1
cran.r-project.org: cheem
Interactively Explore Local Explanations with the Radial Tour
- Homepage: https://github.com/nspyrison/cheem/
- Documentation: http://cran.r-project.org/web/packages/cheem/cheem.pdf
- License: MIT + file LICENSE
-
Latest release: 0.4.1
published 11 months ago
Rankings
Maintainers (1)
Dependencies
- R >= 3.5.0 depends
- DT * imports
- Rcpp * imports
- data.table * imports
- ggplot2 * imports
- magrittr * imports
- plotly * imports
- shiny * imports
- shinycssloaders * imports
- shinythemes * imports
- spinifex >= 0.3.3 imports
- beepr * suggests
- dplyr * suggests
- gbm * suggests
- gganimate * suggests
- knitr * suggests
- lightgbm * suggests
- lqmm * suggests
- mvtnorm * suggests
- randomForest * suggests
- ranger * suggests
- rmarkdown * suggests
- spelling * suggests
- testthat >= 3.0.0 suggests
- tictoc * suggests
- tidyr * suggests
- tourr * suggests
- xgboost * suggests
- JamesIves/github-pages-deploy-action v4.4.1 composite
- actions/checkout v3 composite
- r-lib/actions/setup-pandoc v2 composite
- r-lib/actions/setup-r v2 composite
- r-lib/actions/setup-r-dependencies v2 composite
- r-hub/actions/checkout v1 composite
- r-hub/actions/platform-info v1 composite
- r-hub/actions/run-check v1 composite
- r-hub/actions/setup v1 composite
- r-hub/actions/setup-deps v1 composite
- r-hub/actions/setup-r v1 composite