
CMasher
CMasher: Scientific colormaps for making accessible, informative and 'cmashing' plots - Published in JOSS (2020)
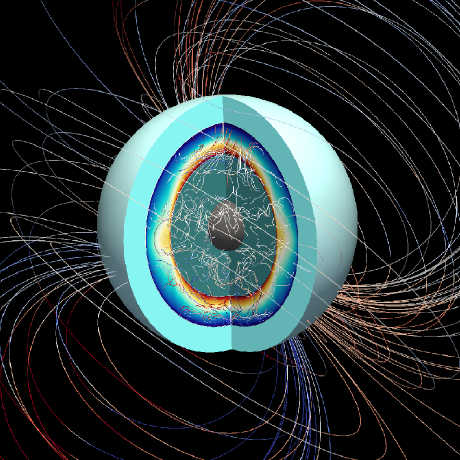
planetMagFields
planetMagFields: A Python package for analyzing and plotting planetary magnetic field data - Published in JOSS (2024)

gaussplotR
gaussplotR: Fit, Predict and Plot 2D-Gaussians in R - Published in JOSS (2021)

ThermoParser
ThermoParser: Streamlined Analysis of Thermoelectric Properties - Published in JOSS (2024)

Makie.jl
Makie.jl: Flexible high-performance data visualization for Julia - Published in JOSS (2021)
napari-clusters-plotter
A napari plugin for clustering objects according to their properties.


mplhep
Extended histogram plotting on top of matplotlib and HEP collaboration compatible styling

UnfoldMakie
Plotting and visualization tools for EEG data, with additional Unfold.jl regression ERP methods. Based on the visualization libraries Makie.jl and AlgebraOfGraphics.jl

xpdlines
A program for plotting powder diffraction patterns and background subtraction


cloupy
CLOUPY IS NO LONGER SUPPORTED. PLEASE, SEE README. cloupy is a Python library for climatological data downloading, processing and visualizing. The main goal of the library is to help its author in writing a BA thesis. The library is well adapted to academic work - used data sources are reliable and graphs are easy to modify.

napari-time-series-plotter
A napari Plugin for visualisaton of pixel values over time (t+ nD) as graphs.


interactive_data_editor
A Software to interactively edit data in a graphical manner


mesa-explorer
Web-based visualization tool for the MESA simulations of stars. Built with Bootstrap 5.3 and d3 v7.8.4


thermomag_plotter
A basic Python script to plot thermomagnetic data. Made as an exercise for GLY6932 (Data and Software) at University of Florida.


unmap
Unmap data from a pseudocolor image, with or without knowing the colormap.


simplexity
Hopefully taking out the complexity of using the simplex: functions to generate, manipulate and plot data on the simplex
