
seaborn
seaborn: statistical data visualization - Published in JOSS (2021)

CMasher
CMasher: Scientific colormaps for making accessible, informative and 'cmashing' plots - Published in JOSS (2020)

pylustrator
pylustrator: code generation for reproducible figures for publication - Published in JOSS (2020)
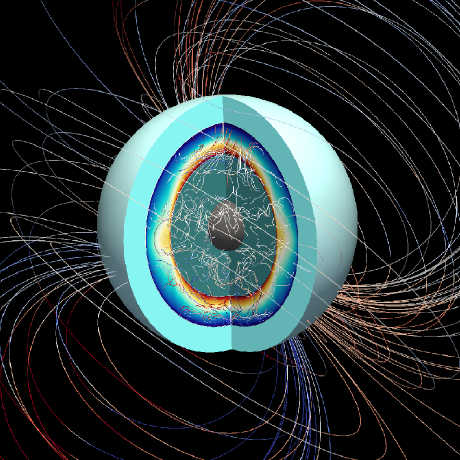
planetMagFields
planetMagFields: A Python package for analyzing and plotting planetary magnetic field data - Published in JOSS (2024)

dantro
dantro: a Python package for handling, transforming, and visualizing hierarchically structured data - Published in JOSS (2020)

ThermoParser
ThermoParser: Streamlined Analysis of Thermoelectric Properties - Published in JOSS (2024)
pytransform3d
pytransform3d: 3D Transformations for Python - Published in JOSS (2019)


pygwalker
PyGWalker: Turn your dataframe into an interactive UI for visual analysis

mplhep
Extended histogram plotting on top of matplotlib and HEP collaboration compatible styling


forestplot
A Python package to make publication-ready but customizable coefficient plots.


outset
add zoom indicators, insets, and magnified panels to matplotlib/seaborn visualizations with ease!

cmcrameri
Making Fabio Crameri's perceptually uniform colourmaps for geosciences available on PyPI and conda-forge

dantro
dantro is a Python package to handle, transform, and visualize hierarchically structured data. Docs @ https://dantro.readthedocs.io — NOTE: This repository is a READ-ONLY-MIRROR of the actual development repository; for open issues and MRs, see there:
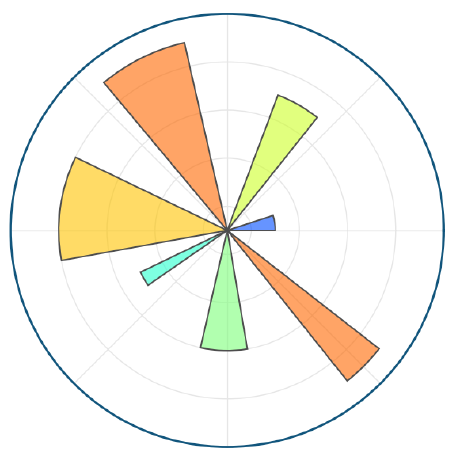


pycirclize
Circular visualization in Python (Circos Plot, Chord Diagram, Radar Chart)


carpenter_workshop
Brian's python workshop, where he keeps his tools, paint, and anything else useful.
pymsaviz
MSA(Multiple Sequence Alignment) visualization python package for sequence analysis

psy-simple
psy-simple: The psyplot plugin for simple visualizations

pydar
A Python package to access, download, view, and manipulate Cassini RADAR images in one place

muller-eot
A Python package for M. Müller implementation of the "Equation of Time - Problem in Astronomy" to calculate the Equation of Time based on the individual effect of eccentricity and obliquity
phytreeviz
Simple phylogenetic tree visualization python package for phylogenetic analysis

handy
Some handy python functions for statistics, computation and plotting (which are missed in numpy and matplotlib).

citation-network-app
An interactive web app that fetches the top 20 related papers from Google Scholar (via SerpAPI), builds a citation graph, and renders it in pages of 10 nodes each.

analytics
PetCare Analytics é uma plataforma avançada para análise inteligente de dados sobre pets, oferecendo dashboard interativo com mapas geoespaciais, análises estatísticas, modelos preditivos de machine learning para otimização de adoções e integração com IA para insights automatizados.


hsf-training-matplotlib
Create commonly used plots in HEP with matplotlib and mplhep
psy-ugrid
A psyplot plugin for decoding unstructured grids following the UGRID conventions

listening-beyond-the-labels-v1
A scalable and non-invasive speech-based machine learning model for early Alzheimer's detection using mel-spectrograms and lightweight semi-supervised CNN with no transcription or neuroimaging needed.
https://github.com/arya-gaj/your-phone-can-spot-fashion-v1
A lightweight yet powerful system that analyzes short-form videos in real time to identify fashion products by combining computer vision and natural language processing, all processed locally.

jcurve
Code for paper "Jerk, Acceleration, and Speed on Inclined Surfaces", 2024.

agenoria
Python utility for visualizing growth data from a newborn's first year, such as feeding, diapering, sleep, and growth, recorded in the Glow Baby app.

quantumcomputing-timeline-formulas
A code repository designed to show the best GitHub has to offer.

decompose
Principal Component Analysis (PCA) Algorithm was implemented to determine the Functional Age of the Power Transformer using Return Voltage Measurement (RVM). [submitted]

ibm-skills-ai-colab-sessions
PORTFOLIO: IBM Skills Build Programme for Artificial Intelligence - CoLab - Live Sessions & Final Project

jupyter_gettingstarted2ml
This Getting Started Tutorial systematically demonstrates the typical ML work process step-by-step using the powerful and performant Support Vector Classifier (SVC) and the beginner-friendly Iris Dataset. Furthermore, the selection of the correct SVC kernel and its parameters are described and their effects on the classification result are shown.

facts
Repository for the article in the online magazine Data Science Collective.

lorepy
A library to create lore plots (logistic regression of the prevalence of a categorical variable in function of a continuous feature)