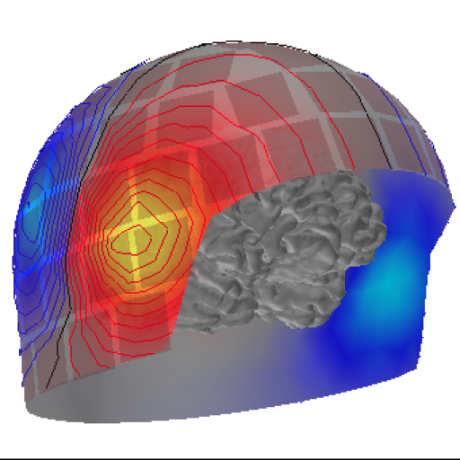
Intracranial Electrode Location and Analysis in MNE-Python
Intracranial Electrode Location and Analysis in MNE-Python - Published in JOSS (2022)

pyam
pyam: a Python Package for the Analysis and Visualization of Models of the Interaction of Climate, Human, and Environmental Systems - Published in JOSS (2019)

Regl-Scatterplot
Regl-Scatterplot: A Scalable Interactive JavaScript-based Scatter Plot Library - Published in JOSS (2023)

PlatiPy
PlatiPy: Processing Library and Analysis Toolkit for Medical Imaging in Python - Published in JOSS (2023)

OpenSpace
OpenSpace: An open-source astrovisualization framework - Published in JOSS (2017)

textnets
textnets: A Python package for text analysis with networks - Published in JOSS (2020)
Jupyter Scatter
Jupyter Scatter: Interactive Exploration of Large-Scale Datasets - Published in JOSS (2024)

PVGeo
PVGeo: an open-source Python package for geoscientific visualization in VTK and ParaView - Published in JOSS (2019)

Delve
Delve: Neural Network Feature Variance Analysis - Published in JOSS (2022)

MiscMetabar
MiscMetabar: an R package to facilitate visualization and reproducibility in metabarcoding analysis - Published in JOSS (2023)


Plonk
Plonk: Smoothed particle hydrodynamics analysis and visualization with Python - Published in JOSS (2019)

rempsyc
rempsyc: Convenience functions for psychology - Published in JOSS (2023)

MicrobiomeR
MicrobiomeR: An R Package for Simplified and Standardized Microbiome Analysis Workflows - Published in JOSS (2019)

The plebeian Graph Library
The plebeian Graph Library: A WebGL based network visualisation and diagnostics package - Published in JOSS (2024)

EDP
EDP: a program for projecting electron densities from VASP onto planes - Published in JOSS (2023)


TLViz
TLViz: Visualising and analysing tensor decomposition models with Python - Published in JOSS (2022)


Makie.jl
Makie.jl: Flexible high-performance data visualization for Julia - Published in JOSS (2021)

pytransform3d
pytransform3d: 3D Transformations for Python - Published in JOSS (2019)


igneous-pipeline
Scalable Neuroglancer compatible Downsampling, Meshing, Skeletonizing, Contrast Normalization, Transfers and more.


maidr-legacy
[DEPRECATED prototype] Multimodal Access and Interactive Data Representation


pygwalker
PyGWalker: Turn your dataframe into an interactive UI for visual analysis


@uwdata/mosaic-core
An extensible framework for linking databases and interactive views.

mplhep
Extended histogram plotting on top of matplotlib and HEP collaboration compatible styling


lida
Automatic Generation of Visualizations and Infographics using Large Language Models

UnfoldMakie
Plotting and visualization tools for EEG data, with additional Unfold.jl regression ERP methods. Based on the visualization libraries Makie.jl and AlgebraOfGraphics.jl

avogadro
Avogadro libraries provide 3D rendering, visualization, analysis and data processing useful in computational chemistry, molecular modeling, bioinformatics, materials science, and related areas.

itk-wasm
High performance spatial analysis in a web browser and across programming languages and hardware architectures


forestplot
A Python package to make publication-ready but customizable coefficient plots.

asreview-insights
Tools such as plots and metrics to analyze (simulated) reviews for ASReview LAB


fsbrain
R library for structural neuroimaging. Provides high-level functions to access (read and write) and visualize surface-based brain morphometry data for individuals and groups.


trviz
A python library for decomposing and visualizing tandem repeat sequences


pytrack
a Map-Matching-based Python Toolbox for Vehicle Trajectory Reconstruction


genome-spy
A visualization grammar and GPU-accelerated toolkit for genomic data

cloupy
CLOUPY IS NO LONGER SUPPORTED. PLEASE, SEE README. cloupy is a Python library for climatological data downloading, processing and visualizing. The main goal of the library is to help its author in writing a BA thesis. The library is well adapted to academic work - used data sources are reliable and graphs are easy to modify.

virelay
ViRelAy is a visualization tool for the analysis of data as generated by CoRelAy.


embedding-atlas
Embedding Atlas is a tool that provides interactive visualizations for large embeddings. It allows you to visualize, cross-filter, and search embeddings and metadata.


dea_limma
A Snakemake workflow and MrBiomics module for performing and visualizing differential (expression) analyses (DEA) on NGS data powered by the R package limma.

dantro
dantro is a Python package to handle, transform, and visualize hierarchically structured data. Docs @ https://dantro.readthedocs.io — NOTE: This repository is a READ-ONLY-MIRROR of the actual development repository; for open issues and MRs, see there:

spilterlize_integrate
A Snakemake workflow and MrBiomics module to split, filter, normalize, integrate and select highly variable features of count matrices resulting from next-generation sequencing (NGS) experiments (e.g., RNA-seq, ATAC-seq, ChIP-seq, Methyl-seq, miRNA-seq,...) including confounding factor analysis and diagnostic visualizations.
mixscape_seurat
A Snakemake workflow and MrBiomics module for performing perturbation analyses of pooled (multimodal) CRISPR screens with sc/snRNA-seq read-out (scCRISPR-seq) powered by the R package Seurat's method Mixscape.
dea_seurat
A Snakemake workflow and MrBiomics module for performing differential expression analyses (DEA) on (multimodal) sc/snRNA-seq data powered by the R package Seurat.


soniscope-jupyter
jupyter notebook widget with a scatter plot and an interactive lens to enable interactive sonification


viztracer
A debugging and profiling tool that can trace and visualize python code execution

fingernat-pymol-plugin
PyMOL plugin to visualize interactions detected by the fingeRNAt program

zol
zol (& fai): large-scale targeted detection and evolutionary investigation of gene clusters (i.e. BGCs, phages, etc.)


eyepy
A python package to read, analyse and visualize OCT and fundus data from various sources.


divbrowse
A web application for interactive visualization and exploratory data analysis of variant call matrices


konigcell
Quantitative, Fast Grid-Based Fields Calculations in 2D and 3D - Residence Time Distributions, Velocity Grids, Eulerian Cell Projections etc.


pycirclize
Circular visualization in Python (Circos Plot, Chord Diagram, Radar Chart)

pymsaviz
MSA(Multiple Sequence Alignment) visualization python package for sequence analysis


psy-simple
psy-simple: The psyplot plugin for simple visualizations


gtoolkit
Glamorous Toolkit is the Moldable Development Environment. It empowers you to make systems explainable through contextual micro tools.
piling.js
A general framework and library for exploring thousands of small multiples