
visdat
visdat: Visualising Whole Data Frames - Published in JOSS (2017)
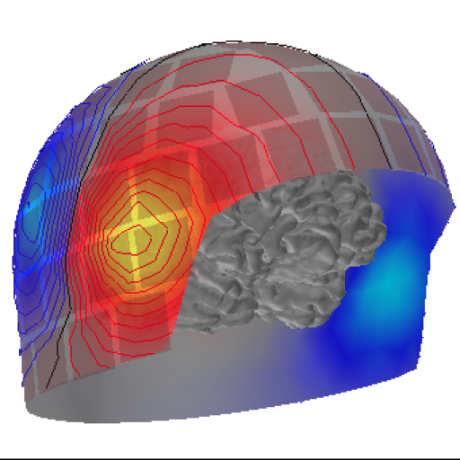
MNE-LSL
MNE-LSL: Real-time framework integrated with MNE-Python for online neuroscience research through LSL-compatible devices. - Published in JOSS (2025)

pylustrator
pylustrator: code generation for reproducible figures for publication - Published in JOSS (2020)

see
see: An R Package for Visualizing Statistical Models - Published in JOSS (2021)

cgeniepy
cgeniepy: A Python package for analysing cGENIE Earth System Model output - Published in JOSS (2024)

ampscan
ampscan: A lightweight Python package for shape analysis of prosthetics and orthotics - Published in JOSS (2020)
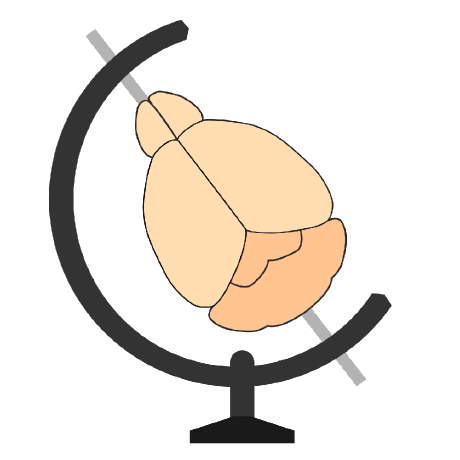
BrainGlobe Atlas API
BrainGlobe Atlas API: a common interface for neuroanatomical atlases - Published in JOSS (2020)

https://github.com/cytoscape/cytoscape.js
Graph theory (network) library for visualisation and analysis

iris
A powerful, format-agnostic, and community-driven Python package for analysing and visualising Earth science data


pyhexwatershed
The Python interface to HexWatershed a mesh independent flow direction model for hydrologic models

nat
NeuroAnatomy Toolbox: An R package for the (3D) visualisation and analysis of biological image data, especially tracings of single neurons.

https://github.com/bokeh/bokeh
Interactive Data Visualization in the browser, from Python


phepy
Intuitive evaluation of out-of-distribution detectors using simple toy examples.

csikit
Python CSI processing and visualisation tools for Atheros, Intel, Nexmon, ESP32, FeitCSI, and PicoScenes (USRP, etc) formats.

svist4get
A simple visualisation tool for genomic tracks from sequencing experiments.


https://github.com/calfem/calfem-python
CALFEM for Python is the Python port of the CALFEM finite element toolkit. It also implements meshing function based on GMSH and triangle. Visualisation routines are implemented using visvis and matplotlib.

baltic
baltic - backronymed adaptable lightweight tree import code for molecular phylogeny manipulation, analysis and visualisation. Development is back on the evogytis/baltic branch (i.e. here).


AdhereR
Computation of adherence to medications from Electronic Healthcare Data in R


https://github.com/grafana-toolbox/grafanimate
Animate timeseries data with Grafana.


notebook-examples
Example notebooks showing how to work with ECMWF services and data

ipyvolume
3d plotting for Python in the Jupyter notebook based on IPython widgets using WebGL

rcosmo
Handle and Analyse Spherical, HEALPix and Cosmic Microwave Background data on a HEALPix grid.

https://github.com/berenslab/medical-t-simcne
This repository contains the codes to train a t-SimCNE model. This model has been shown to produce good representations on natural and medical images.

pyrddlgym
A toolkit for auto-generation of OpenAI Gym environments from RDDL description files.


https://github.com/alceal/plotlars
Plotlars is a Rust library designed to facilitate the integration between the Polars data analysis library and Plotly library.


https://github.com/bigraph-toolkit-suite/bigraphs.ide.bigellor
Bigellor is a web-based editor for the visual modeling of bigraphs.