PyVista
PyVista: 3D plotting and mesh analysis through a streamlined interface for the Visualization Toolkit (VTK) - Published in JOSS (2019)

CMasher
CMasher: Scientific colormaps for making accessible, informative and 'cmashing' plots - Published in JOSS (2020)

corner.py
corner.py: Scatterplot matrices in Python - Published in JOSS (2016)

see
see: An R Package for Visualizing Statistical Models - Published in JOSS (2021)

Sciris
Sciris: Simplifying scientific software in Python - Published in JOSS (2023)

tidyHeatmap
tidyHeatmap: an R package for modular heatmap production based on tidy principles - Published in JOSS (2020)
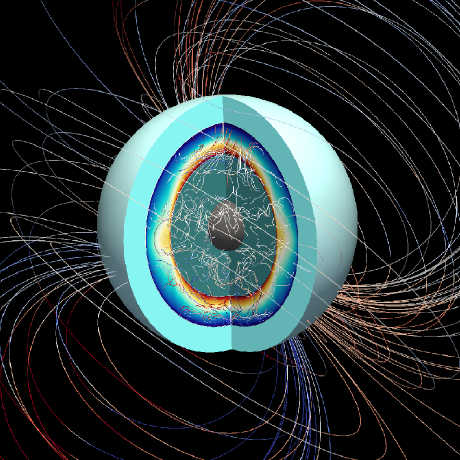
planetMagFields
planetMagFields: A Python package for analyzing and plotting planetary magnetic field data - Published in JOSS (2024)

LobsterPy
LobsterPy: A package to automatically analyze LOBSTER runs - Published in JOSS (2024)

gaussplotR
gaussplotR: Fit, Predict and Plot 2D-Gaussians in R - Published in JOSS (2021)

ThermoParser
ThermoParser: Streamlined Analysis of Thermoelectric Properties - Published in JOSS (2024)

PolarToolkit
PolarToolkit: Python Tools for Convenient, Reproducible, and Open Polar Science - Published in JOSS (2024)

Makie.jl
Makie.jl: Flexible high-performance data visualization for Julia - Published in JOSS (2021)
napari-clusters-plotter
A napari plugin for clustering objects according to their properties.
plotastic
plotastic: Bridging Plotting and Statistics in Python - Published in JOSS (2024)
itrm
itrm: Interactive Terminal Utilities - Published in JOSS (2024)

mplhep
Extended histogram plotting on top of matplotlib and HEP collaboration compatible styling

UnfoldMakie
Plotting and visualization tools for EEG data, with additional Unfold.jl regression ERP methods. Based on the visualization libraries Makie.jl and AlgebraOfGraphics.jl

xpdlines
A program for plotting powder diffraction patterns and background subtraction


cloupy
CLOUPY IS NO LONGER SUPPORTED. PLEASE, SEE README. cloupy is a Python library for climatological data downloading, processing and visualizing. The main goal of the library is to help its author in writing a BA thesis. The library is well adapted to academic work - used data sources are reliable and graphs are easy to modify.

https://github.com/bokeh/bokeh
Interactive Data Visualization in the browser, from Python

napari-time-series-plotter
A napari Plugin for visualisaton of pixel values over time (t+ nD) as graphs.


interactive_data_editor
A Software to interactively edit data in a graphical manner

sumo
sumo: Command-line tools for plotting and analysis of periodic *ab initio* calculations - Published in JOSS (2018)


pyjams
A general Python package with miscellaneous utility functions used in several other packages.

https://github.com/holoviz/holoviews
With Holoviews, your data visualizes itself.
fgivenx
fgivenx: A Python package for functional posterior plotting - Published in JOSS (2018)
https://github.com/holoviz/hvplot
A high-level plotting API for pandas, dask, xarray, and networkx built on HoloViews


metpy
MetPy is a collection of tools in Python for reading, visualizing and performing calculations with weather data.


https://github.com/reiinakano/scikit-plot
An intuitive library to add plotting functionality to scikit-learn objects.


https://github.com/sefffal/pairplots.jl
Beautiful and flexible vizualizations of high dimensional data


https://github.com/aenarete/controlplots.jl
Easy to use plotting for control engineers and students

https://github.com/bendichter/brokenaxes
Create matplotlib plots with broken axes


https://github.com/janosh/matterviz
Interactive browser visualizations for materials science: periodic tables, 3d crystal structures, MD trajectories, heatmaps, scatter plots, histograms.


pyglotaran-extras
Extra batteries to super-charge pyglotaran's plotting capabilities.


sunburst
Draw sunburst charts/hierarchical pie plots ("multi-level" pie plots of hierarchical data as e.g., in disk usage diagrams)


https://github.com/shitohana/BSXplorer
Comprehensive tool for visualizing genome-wide cytosine data.

https://github.com/benjaminleroy/cowpatch
pythonic ggplot image combinations https://benjaminleroy.github.io/cowpatch


gis4wrf
QGIS toolkit 🧰 for pre- and post-processing 🔨, visualizing 🔍, and running simulations 💻 in the Weather Research and Forecasting (WRF) model 🌀

codaredistlm
Functions to analyse compositional data and produce confidence intervals for relative increases and decreases in the compositional components

ipyvolume
3d plotting for Python in the Jupyter notebook based on IPython widgets using WebGL

plotGrouper
A shiny app-based GUI wrapper for ggplot2 with built-in statistical analysis.


pyprocessmacro
A Python library for moderation, mediation and conditional process analysis.

https://github.com/mithi/bare-minimum-2d
An extremely lightweight React component to declaratively (and elegantly) plot shapes on an inline SVG

https://github.com/ccampjr/sciplot-pyqt
A Matplotlib-wrapped user-interface for creating and editing publication-ready images and plots

https://github.com/arcticsnow/snowpyt
Python package to load, manipulate and plot snowpit data.

https://github.com/iniceice88/oxyplot-js


https://github.com/const-ae/motif_plotter
A simple tool to create DNA motif plots based directly on matplotlib to enable construction of complex plots


https://github.com/mineralscloud/crystallographyrecipes.jl
Plotting crystal structures and relevant data obtained from CrystallographyBase.jl and Crystallography.jl


https://github.com/avapolzin/albumpl
Custom matplotlib color palettes based on album covers.

mcplot
A Python package with a plotting class and routines for publication-ready graphics

https://github.com/jhidding/gnuplotlite.jl
Responsive and composable no-nonsense interface to Gnuplot
simplexity
Hopefully taking out the complexity of using the simplex: functions to generate, manipulate and plot data on the simplex
https://github.com/avapolzin/rahrah
University-inspired matplotlib color palettes and colormaps.

Jabberwocky
Jabberwocky: an ontology-aware toolkit for manipulating text - Published in JOSS (2020)

GNU Data Language 1.0
GNU Data Language 1.0: a free/libre and open-source drop-in replacement for IDL/PV-WAVE - Published in JOSS (2022)
