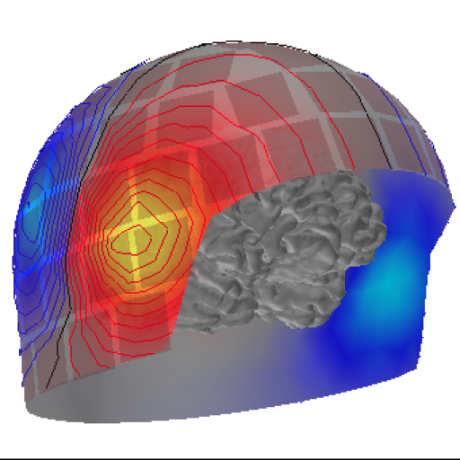
Intracranial Electrode Location and Analysis in MNE-Python
Intracranial Electrode Location and Analysis in MNE-Python - Published in JOSS (2022)

UMAP
UMAP: Uniform Manifold Approximation and Projection - Published in JOSS (2018)
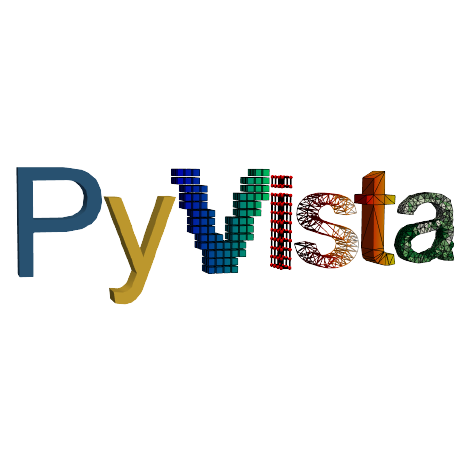
PyVista
PyVista: 3D plotting and mesh analysis through a streamlined interface for the Visualization Toolkit (VTK) - Published in JOSS (2019)

Yellowbrick
Yellowbrick: Visualizing the Scikit-Learn Model Selection Process - Published in JOSS (2019)

pyam
pyam: a Python Package for the Analysis and Visualization of Models of the Interaction of Climate, Human, and Environmental Systems - Published in JOSS (2019)

Regl-Scatterplot
Regl-Scatterplot: A Scalable Interactive JavaScript-based Scatter Plot Library - Published in JOSS (2023)

PlatiPy
PlatiPy: Processing Library and Analysis Toolkit for Medical Imaging in Python - Published in JOSS (2023)

OpenSpace
OpenSpace: An open-source astrovisualization framework - Published in JOSS (2017)

textnets
textnets: A Python package for text analysis with networks - Published in JOSS (2020)
Jupyter Scatter
Jupyter Scatter: Interactive Exploration of Large-Scale Datasets - Published in JOSS (2024)

PVGeo
PVGeo: an open-source Python package for geoscientific visualization in VTK and ParaView - Published in JOSS (2019)
GemGIS - Spatial Data Processing for Geomodeling
GemGIS - Spatial Data Processing for Geomodeling - Published in JOSS (2022)

Netgraph
Netgraph: Publication-quality Network Visualisations in Python - Published in JOSS (2023)

see
see: An R Package for Visualizing Statistical Models - Published in JOSS (2021)

FSharpGephiStreamer
FSharpGephiStreamer: An idiomatic bridge between F# and network visualization - Published in JOSS (2019)

Delve
Delve: Neural Network Feature Variance Analysis - Published in JOSS (2022)

MiscMetabar
MiscMetabar: an R package to facilitate visualization and reproducibility in metabarcoding analysis - Published in JOSS (2023)

modelStudio
modelStudio: Interactive Studio with Explanations for ML Predictive Models - Published in JOSS (2019)

archetypal
archetypal: A Python package for collecting, simulating, converting and analyzing building archetypes - Published in JOSS (2020)


Plonk
Plonk: Smoothed particle hydrodynamics analysis and visualization with Python - Published in JOSS (2019)

ewstools
ewstools: A Python package for early warning signals of bifurcations in time series data - Published in JOSS (2023)

rempsyc
rempsyc: Convenience functions for psychology - Published in JOSS (2023)

MicrobiomeR
MicrobiomeR: An R Package for Simplified and Standardized Microbiome Analysis Workflows - Published in JOSS (2019)

RSMTool
RSMTool: collection of tools building and evaluating automated scoring models - Published in JOSS (2016)

Kepler Mapper
Kepler Mapper: A flexible Python implementation of the Mapper algorithm. - Published in JOSS (2019)

TDAstats
TDAstats: R pipeline for computing persistent homology in topological data analysis - Published in JOSS (2018)

VisualTorch
VisualTorch: Streamlining Visualization for PyTorch Neural Network Architectures - Published in JOSS (2024)

HiPart
HiPart: Hierarchical Divisive Clustering Toolbox - Published in JOSS (2023)

Psifr
Psifr: Analysis and visualization of free recall data - Published in JOSS (2020)

The plebeian Graph Library
The plebeian Graph Library: A WebGL based network visualisation and diagnostics package - Published in JOSS (2024)

EDP
EDP: a program for projecting electron densities from VASP onto planes - Published in JOSS (2023)

mrivis
mrivis: Medical image visualization library for neuroscience in python - Published in JOSS (2018)


TLViz
TLViz: Visualising and analysing tensor decomposition models with Python - Published in JOSS (2022)


cartoee
cartoee: Publication quality maps using Earth Engine - Published in JOSS (2019)

egtplot
egtplot: A Python Package for Three-Strategy Evolutionary Games - Published in JOSS (2018)

Makie.jl
Makie.jl: Flexible high-performance data visualization for Julia - Published in JOSS (2021)

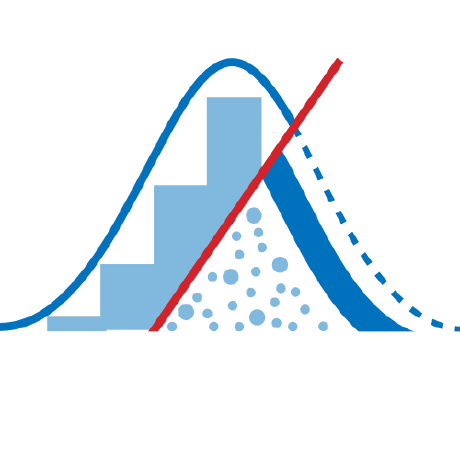
Simulation Decomposition in Python
Simulation Decomposition in Python - Published in JOSS (2024)
Visualizing alpha-helical peptides in R with helixvis
Visualizing alpha-helical peptides in R with helixvis - Published in JOSS (2018)

Open Source Optical Coherence Tomography Software
Open Source Optical Coherence Tomography Software - Published in JOSS (2020)

QMRTools
QMRTools: a Mathematica toolbox for quantitative MRI analysis. - Published in JOSS (2019)

pytransform3d
pytransform3d: 3D Transformations for Python - Published in JOSS (2019)

Tidytacos
Tidytacos: An R package for analyses on taxonomic composition of microbial communities - Published in JOSS (2025)

ect: A Python Package for the Euler Characteristic Transform
ect: A Python Package for the Euler Characteristic Transform - Published in JOSS (2026)

Plotrr
Plotrr: Functions for making visual exploratory data analysis with nested data easier. - Published in JOSS (2017)


igneous-pipeline
Scalable Neuroglancer compatible Downsampling, Meshing, Skeletonizing, Contrast Normalization, Transfers and more.


https://github.com/cytoscape/cytoscape.js
Graph theory (network) library for visualisation and analysis

maidr-legacy
[DEPRECATED prototype] Multimodal Access and Interactive Data Representation


pygwalker
PyGWalker: Turn your dataframe into an interactive UI for visual analysis


@uwdata/mosaic-core
An extensible framework for linking databases and interactive views.

mplhep
Extended histogram plotting on top of matplotlib and HEP collaboration compatible styling


lida
Automatic Generation of Visualizations and Infographics using Large Language Models

UnfoldMakie
Plotting and visualization tools for EEG data, with additional Unfold.jl regression ERP methods. Based on the visualization libraries Makie.jl and AlgebraOfGraphics.jl

avogadro
Avogadro libraries provide 3D rendering, visualization, analysis and data processing useful in computational chemistry, molecular modeling, bioinformatics, materials science, and related areas.

itk-wasm
High performance spatial analysis in a web browser and across programming languages and hardware architectures


Chemiscope
Chemiscope: interactive structure-property explorer for materials and molecules - Published in JOSS (2020)

vedo
A python module for scientific analysis of 3D data based on VTK and Numpy

forestplot
A Python package to make publication-ready but customizable coefficient plots.


asreview-insights
Tools such as plots and metrics to analyze (simulated) reviews for ASReview LAB


fsbrain
R library for structural neuroimaging. Provides high-level functions to access (read and write) and visualize surface-based brain morphometry data for individuals and groups.


trviz
A python library for decomposing and visualizing tandem repeat sequences

VAPOR
VAPOR is the Visualization and Analysis Platform for Ocean, Atmosphere, and Solar Researchers


act
Atmospheric data Community Toolkit - A python based toolkit for exploring and analyzing time series atmospheric datasets

https://github.com/bluebrain/neuromorphovis
A lightweight, interactive, extensible and cross-platform framework for building, visualizing and analyzing digital reconstructions of neuronal morphology skeletons extracted from microscopy stacks.

pytrack
a Map-Matching-based Python Toolbox for Vehicle Trajectory Reconstruction


genome-spy
A visualization grammar and GPU-accelerated toolkit for genomic data


cloupy
CLOUPY IS NO LONGER SUPPORTED. PLEASE, SEE README. cloupy is a Python library for climatological data downloading, processing and visualizing. The main goal of the library is to help its author in writing a BA thesis. The library is well adapted to academic work - used data sources are reliable and graphs are easy to modify.

virelay
ViRelAy is a visualization tool for the analysis of data as generated by CoRelAy.


embedding-atlas
Embedding Atlas is a tool that provides interactive visualizations for large embeddings. It allows you to visualize, cross-filter, and search embeddings and metadata.


https://github.com/bokeh/bokeh
Interactive Data Visualization in the browser, from Python

https://github.com/glue-viz/glue
Linked Data Visualizations Across Multiple Files

ete3
Python package for building, comparing, annotating, manipulating and visualising trees. It provides a comprehensive API and a collection of command line tools, including utilities to work with the NCBI taxonomy tree.


dea_limma
A Snakemake workflow and MrBiomics module for performing and visualizing differential (expression) analyses (DEA) on NGS data powered by the R package limma.