
networks-of-roman-eleusis
A Digital Scholarship Tool for Studying Ancient Epigraphy

https://github.com/acclab/dabest-python
Data Analysis with Bootstrapped ESTimation

digital-atlas
Interface to visualise connections between postcolonial intellectuals


digimon-world-survey
Data and R-code for survey conducted about Digimon World 1

coldcuts
coldcuts is an R package to automatically generate and plot segmentation drawings in R


https://github.com/aanzel/polar-diagrams-dashboard
"A Multi-Technique Strategy for Improving Summary Polar Diagrams" by Aleksandar Anžel, Zewen Yang, and Georges Hattab
https://github.com/aanzel/tvsds
Supplementary material for the paper The Visual Story of Data Storage: From Storage Properties to User Interfaces, by Aleksandar Anžel, Dominik Heider, and Georges Hattab


https://github.com/csinva/global-sports-analysis
Analyzing how different factors influence global sports rankings

iheatmapr
iheatmapr: Interactive complex heatmaps in R - Published in JOSS (2017)


https://github.com/asjadnaqvi/the-stata-guide
Files for the Stata Guide on Medium https://medium.com/the-stata-guide


rseb
An R-package for daily tasks required to handle biological data as well as avoid re-coding of small functions for quick but necessary data management.

survey_dashboard
A dashboard build with bokeh to provide interative data visualization and exploration of survey results.


ftlav
FTL Adventure Visualiser: a data recording and visualisation tool for FTL: Faster Than Light

top-countries-mentioned-by-donald-trump
🌎 A data visualization project showing the top countries and diplomatic relations mentioned by Donald Trump in his presidential term from 2017 to 2020.(展示唐纳德·特朗普在其2017年至2020年总统任期内提及的国家外交关系的数据可视化。)

cer-beans
CER ⋅ BEANS: Community Engaged Research Balanced Expressions and Assessments with Nuanced Scores
polar-diagrams-for-model-comparison
"Interactive Polar Diagrams for Model Comparison" by Aleksandar Anžel, Dominik Heider, and Georges Hattab

extra-dimensional-muon-anomalies
Quantum Simulation of Extra-Dimensional Contributions to Muon Anomalies

https://github.com/abrg-models/morphologica
C++ header-only graphing and data visualization with Modern OpenGL

https://github.com/corybrunson/ordr
manage ordinations and render biplots in a tidyverse workflow

annodash
[JAMIA Open] A clinical terminology annotation dashboard created using Plotly Dash & the MIMIC-IV database.

swelling_tablet_fronts_d_k_from_mri_t2_or_img
Tool for calculating swelling tablet eroding front's diffusion rate D and the rate of the swelling k from time series of either T2-maps or MRI images in FDF or Text Image format. (Python 3)

https://github.com/csu-agricultural-water-quality-program/als-data-cleaning-tool
A coding tool developed in R to take water analysis results exported from the ALS WEBTRIEVE™ data portal. Exported data are cleaned, merged, and exported into archiving (e.g., CSV) or visual (e.g., HTML) formats.
https://github.com/danielvartan/linear-models
🐧🧊 General Linear Models Using Penguins

MDPIexploreR
A simple package to explore MDPI´s articles by journal. A series of functions help to obtain lists of papers, obtain data from them (turnaround times, special issues and articles types) and create summary graphs.


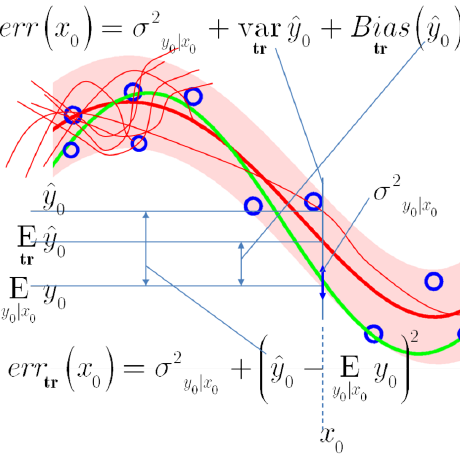
teaching
Teaching Materials for Dr. Waleed A. Yousef

mapdrawingscriptforr
The script can be used to draw maps in R. It is also a reproduction script for maps that were created for two articles.

https://github.com/dsnchz/solid-highcharts
A SolidJS wrapper for Highcharts with full reactivity, lifecycle management, and TypeScript support.

nf-vuegen
nf-core module designed to automate report generation from outputs produced by other modules, subworkflows, or pipelines. VueGen creates reports from bioinformatics outputs, supporting formats like PDF, HTML, DOCX, ODT, PPTX, Reveal.js, Jupyter notebooks, and Streamlit web applications.
https://github.com/dsnchz/solid-uplot
SolidJS wrapper for uPlot — an ultra-fast, tiny time-series & charting library with a SolidJS enhanced plugin system

epds_ez
This project has been realized in the framework of the 90154 - Electronic Publishing and Digital Storytelling course taught by Prof. Marilena Daquino for the 2nd year DHDK Master Degree a.a. 2021-22. It visualizes some characteristics of the Partizione Antica of the Supino photographic Archival fund that has been analysed using both structured meta

datoviz
⚡ Datoviz: high-performance GPU rendering for scientific data visualization
PRISMA
Generate checklists and flow diagrams based on the Preferred Reporting Items for Systematic Reviews and Meta-Analyses (PRISMA)

https://github.com/ahmedshahriar/pulsepoint-data-analytics
EDA, data processing, cleaning and extensive geospatial analysis on a selenium based web scraped dataset

https://github.com/simantalahkar/lammpskit
lammpskit is a Python toolkit for post-processing and analyzing molecular dynamics (MD) simulations with LAMMPS. Its modular data processing and analysis functions are broadly applicable to scientific computing, data engineering, and machine learning workflows involving time series or semi-structured data.


women-of-coal-revisited
This is a text analysis project which utilizes localized oral histories in order to highlight topics, labor trends, and women's history in Appalachian coal mining towns. Original archival sources from the University of Kentucky Nunn Center for Oral History "Appalachia: Women of Coal" Collection & the 1996 Women of Coal primary oral history reader.

https://github.com/amberlee2427/themicrolensersguidetothegalaxy
The goal of this project is to create an all-encompassing collection of Jupyter notebooks—your trusty companions for engaging exercises related to microlensing. Through these notebooks, the insights and experiences of microlensing elders can light your path as you embark on your journey of discovery and exploration through scientific research.


https://github.com/philippmeder/visdata
Useful python tools for data visualisation, e.g. 2D-profiles (also known as profile plots), comparison of measurements, or tables.

book
Hands-On Data Visualization: Interactive Storytelling from Spreadsheets to Code is an open-access book, also published with O'Reilly Media.

active-time-hypothesis2
The Active Time Hypothesis: Unveiling Temporal Dynamics in Quantum Entanglement

https://github.com/billbillbilly/perceived-safety-around-bus-stops
Web mapping of perceived safety of bus stops in Detroit


https://github.com/dalmolingroup/easylayout
interactive force-directed graph layouts within RStudio

internet-visualization
Source code of "Towards an interactive visualization of the Internet".

https://github.com/civicdatalab/hp-fiscal-data-explorer-frontend
Frontend for Himachal Pradesh Fiscal Data explorer for Open Budgets India Platform

pricepoints
Price Points research, data analyses, and packages. Informational only, not official Turquoise Health products

cancerpainclassifier
The project is in Beta, it will be a library containing modular pipeline tools to train different IA models in order to help the selection treatments for a patient suffering from cancer by reading some Pet scan

makaho
🥤 MAKAHO (for MAnn-Kendall Analysis of Hydrological Observations) is an interactive cartographic visualization system that allows to calculate trends present in data from hydrometric stations with flows which are little influenced by human actions
exstat
🌾 R package to provide an efficient and simple solution to aggregate and analyze the stationarity of time series


https://github.com/dimits-ts/visualization-assignments
Visualizing and analyzing results from the PISA-2018 competitions with regards to Greek performance and gender gap.

https://github.com/dineshpinto/nft-analytics
Modeling Ethereum NFTs using lognormal models and trait based pricing

braph-2
BRAPH 2.0 is a comprehensive software package for the analysis and visualization of brain connectivity data, offering flexible customization, rich visualization capabilities, and a platform for collaboration in neuroscience research.


data-visualization
Building interactive charts and visualizing data with Tableau, R and Python.

oscillation-adaptability
🔄 Discover how oscillations emerge as a mathematical necessity in complex systems. A rigorous framework proving C+A=1 with 10^-16 precision. 📊 Visualize adaptability landscapes & spectral fingerprints.

iwac-sentiment-analysis
Interactive visualization of sentiment analysis on the Islam West Africa Collection (IWAC) corpus, comparing ChatGPT vs Gemini with multilingual support and advanced filtering.
active-time-hypothesis
Reimagining Quantum Non-Locality: Simulating Entangled Systems with the Active Time Hypothesis

https://github.com/altunenes/asap-rs
Zero-dependency Rust implementation of ASAP (Automatic Smoothing for Attention Prioritization) for Time Series

https://github.com/dsnchz/solid-lightweight-charts
TradingView Lightweight Charts™ as SolidJS components

ocean-data-map-project
The Ocean Navigator is an online tool that is used to help visualise scientific research data. a users guide is available at https://dfo-ocean-navigator.github.io/Ocean-Navigator-Manual/ and the tool is live at


isopleuros
Ternary Plots - :exclamation: This is a read-only mirror from https://codeberg.org/tesselle/isopleuros

rath
Next generation of automated data exploratory analysis and visualization platform.


prettyglm
prettyglm provides a set of functions which can easily create beautiful coefficient summaries which can readily be shared and explained.

mdv-climex
An RShiny web application for visualizing high frequency meteorological data and identifying extreme climate events in the McMurdo Dry Valleys of Antarctica.


https://github.com/dimits-ts/visualization-team-project
Team project visualizing various views for an established bike-sharing company. Includes a written report, presentation, R-code and Tableau files

eplant_plant_efp
A data visualization tool to display tissue expression data for Arabidopsis thaliana
vuegen
VueGen automates the creation of reports from bioinformatics outputs, supporting formats like PDF, HTML, DOCX, ODT, PPTX, Reveal.js, Jupyter notebooks, and Streamlit web applications. Users simply provide a directory with output files and VueGen compiles them into a structured report.

https://github.com/rio-labs/rio
WebApps in pure Python. No JavaScript, HTML and CSS needed

Pore2Chip
Pore2Chip: All-in-one python tool for soil microstructure analysis and micromodel design - Published in JOSS (2025)

marsilea
Declarative creation of composable visualization for Python (Complex heatmap, Upset plot, Oncoprint and more~)

jupyter-scatter-tutorial
Jupyter Scatter Tutorial (that was first presented at SciPy '23)

https://github.com/adamouization/python-machine-learning-data-science-notes
:orange_book: Jupyter notebooks containing useful Python code and notes for general Machine Learning and Data Science projects.