
seaborn
seaborn: statistical data visualization - Published in JOSS (2021)

Yellowbrick
Yellowbrick: Visualizing the Scikit-Learn Model Selection Process - Published in JOSS (2019)

CMasher
CMasher: Scientific colormaps for making accessible, informative and 'cmashing' plots - Published in JOSS (2020)


mpl-interactions
mpl-interactions: A Python Package for Interactive Matplotlib Figures - Published in JOSS (2024)

pylustrator
pylustrator: code generation for reproducible figures for publication - Published in JOSS (2020)

Netgraph
Netgraph: Publication-quality Network Visualisations in Python - Published in JOSS (2023)

Sciris
Sciris: Simplifying scientific software in Python - Published in JOSS (2023)
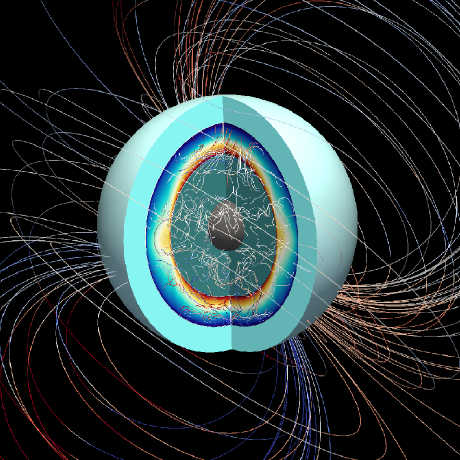
planetMagFields
planetMagFields: A Python package for analyzing and plotting planetary magnetic field data - Published in JOSS (2024)

dantro
dantro: a Python package for handling, transforming, and visualizing hierarchically structured data - Published in JOSS (2020)

ThermoParser
ThermoParser: Streamlined Analysis of Thermoelectric Properties - Published in JOSS (2024)

Syd
Syd: A package for making interactive data visualizations in python - Published in JOSS (2025)

pytransform3d
pytransform3d: 3D Transformations for Python - Published in JOSS (2019)

plotastic
plotastic: Bridging Plotting and Statistics in Python - Published in JOSS (2024)

IBCAO_py
IBCAO_py: A matplotlib library for using the International Bathymetric Chart of the Arctic Ocean with cartopy and matplotlib - Published in JOSS (2017)

pygwalker
PyGWalker: Turn your dataframe into an interactive UI for visual analysis

mplhep
Extended histogram plotting on top of matplotlib and HEP collaboration compatible styling


forestplot
A Python package to make publication-ready but customizable coefficient plots.


outset
add zoom indicators, insets, and magnified panels to matplotlib/seaborn visualizations with ease!
anesthetic
anesthetic: nested sampling visualisation - Published in JOSS (2019)

cmcrameri
Making Fabio Crameri's perceptually uniform colourmaps for geosciences available on PyPI and conda-forge


https://github.com/alan-turing-institute/distinctipy
A lightweight package for generating visually distinct colours.

dantro
dantro is a Python package to handle, transform, and visualize hierarchically structured data. Docs @ https://dantro.readthedocs.io — NOTE: This repository is a READ-ONLY-MIRROR of the actual development repository; for open issues and MRs, see there:

fgivenx
fgivenx: A Python package for functional posterior plotting - Published in JOSS (2018)


pycomplexheatmap
PyComplexHeatmap: A Python package to plot complex heatmap (clustermap)


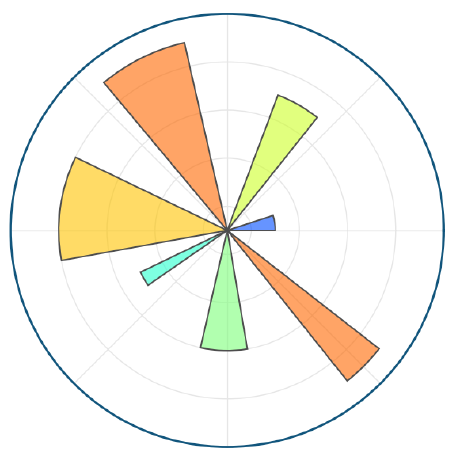
pycirclize
Circular visualization in Python (Circos Plot, Chord Diagram, Radar Chart)


carpenter_workshop
Brian's python workshop, where he keeps his tools, paint, and anything else useful.


pymsaviz
MSA(Multiple Sequence Alignment) visualization python package for sequence analysis

psy-simple
psy-simple: The psyplot plugin for simple visualizations

pydar
A Python package to access, download, view, and manipulate Cassini RADAR images in one place

https://github.com/calfem/calfem-python
CALFEM for Python is the Python port of the CALFEM finite element toolkit. It also implements meshing function based on GMSH and triangle. Visualisation routines are implemented using visvis and matplotlib.

https://github.com/rootpy/rootpy
A pythonic interface for the ROOT libraries on top of the PyROOT bindings.

muller-eot
A Python package for M. Müller implementation of the "Equation of Time - Problem in Astronomy" to calculate the Equation of Time based on the individual effect of eccentricity and obliquity
phytreeviz
Simple phylogenetic tree visualization python package for phylogenetic analysis

handy
Some handy python functions for statistics, computation and plotting (which are missed in numpy and matplotlib).

reptate
RepTate (Rheology of Entangled Polymers: Toolkit for Analysis of Theory & Experiment)

https://github.com/bendichter/brokenaxes
Create matplotlib plots with broken axes


https://github.com/daskol/mpl-typst
Typst backend for matplotlib (Python visualization library).

https://github.com/csinva/data-viz-utils
Functions for easily making publication-quality figures with matplotlib.


https://github.com/atomiechen/matsense
A toolkit for matrix sensor data processing 阵列传感器数据处理工具库

practicalstats-pucsp-2024
Statistical Measures in Python - Age and Salary Analysis

https://github.com/galihru/githubiotpy
GitHubIoT is a comprehensive toolkit designed to simplify the visualization of IoT (Internet of Things) data with seamless GitHub integration. The application provides an intuitive graphical interface for real-time data monitoring, analysis, and configuration

cividis
Register `cividis` with matplotlib, a color map optimized for color vision deficiency, as published in Nuñez, et al. (2018), PLoS ONE 13(7): e0199239 .


https://github.com/wearepal/data-science-types
Mypy stubs, i.e., type information, for numpy, pandas and matplotlib

https://github.com/ccampjr/sciplot-pyqt
A Matplotlib-wrapped user-interface for creating and editing publication-ready images and plots

https://github.com/aryashah2k/quantum-computing-collection-of-resources
A Well Maintained Repository On Quantum Computing Resources [Code+Theory] Updated Regularly During My Time At IBM, Qubit x Qubit And The Coding School's Introduction To Quantum Computing Course '21

https://github.com/anicusan/pypinch
A lightweight Python module that applies Pinch Technology principles, analysing a given set of stream data to find the Maximum Energy Recovery (MER) target.

https://github.com/danielpuentee/outdpik
The fundamental toolkit for outliers search and visualization. It aims to be the fundamental high-level package for this purpose.


https://github.com/const-ae/motif_plotter
A simple tool to create DNA motif plots based directly on matplotlib to enable construction of complex plots

https://github.com/ahmedshahriar/sentiment-analysis
Sentiment Analysis Projects
https://github.com/SimonBlanke/search-data-explorer
Visualize search-data from your gradient-free-optimization run.
https://github.com/ahmedshahriar/housing-price-prediction
Data science project on Housing Prices Dataset regression analysis

analytics
PetCare Analytics é uma plataforma avançada para análise inteligente de dados sobre pets, oferecendo dashboard interativo com mapas geoespaciais, análises estatísticas, modelos preditivos de machine learning para otimização de adoções e integração com IA para insights automatizados.
https://github.com/gagolews/analiza_danych_w_jezyku_python
M. Gągolewski, M. Bartoszuk, A. Cena, Przetwarzanie i analiza danych w języku Python, PWN, 2016

lorepy
A library to create lore plots (logistic regression of the prevalence of a categorical variable in function of a continuous feature)

https://github.com/astropenguin/pipenv-analysis-startup
:penguin: Example of IPython/Jupyter/matplotlib custom configs in a Pipenv's environment
https://github.com/astropenguin/pipenv-analysis-configs
:penguin: Create IPython, Jupyter, matplotlib custom configs in a Pipenv's environment

https://github.com/arya-gaj/your-phone-can-spot-fashion-v1
A lightweight yet powerful system that analyzes short-form videos in real time to identify fashion products by combining computer vision and natural language processing, all processed locally.

citation-network-app
An interactive web app that fetches the top 20 related papers from Google Scholar (via SerpAPI), builds a citation graph, and renders it in pages of 10 nodes each.


ibm-skills-ai-colab-sessions
PORTFOLIO: IBM Skills Build Programme for Artificial Intelligence - CoLab - Live Sessions & Final Project

https://github.com/aaronjs99/colonet
CoLoNet: Collaborative Localization in Wireless Sensor Networks

https://github.com/ahmedshahriar/pulsepoint-data-analytics
EDA, data processing, cleaning and extensive geospatial analysis on a selenium based web scraped dataset

nbody
Repo for my coursework for PHYS281 Scientific Programming and Modelling. A Library to simulate the interaction of solid bodies in 3D, and be able to graphically display motion or output in multiple forms. Integrates JPLHorizons data to be able to use in simulation.

https://github.com/avapolzin/rahrah
University-inspired matplotlib color palettes and colormaps.

jupyter_gettingstarted2ml
This Getting Started Tutorial systematically demonstrates the typical ML work process step-by-step using the powerful and performant Support Vector Classifier (SVC) and the beginner-friendly Iris Dataset. Furthermore, the selection of the correct SVC kernel and its parameters are described and their effects on the classification result are shown.
psy-ugrid
A psyplot plugin for decoding unstructured grids following the UGRID conventions

mcplot
A Python package with a plotting class and routines for publication-ready graphics

https://github.com/pranabdas/arpespythontools
Explore, analyze, visualize Angle Resolved Photoemission Spectroscopy (ARPES) data.